















"The best thing about Caplena is its data visualization. The charts are simple to share and easy for all teams to understand."
Go to Customer StoryThe best thing about Caplena is its data visualization. The charts are simple to share and easy for all teams to understand."

Analysis that reveals why, not just what
Caplena handles qualitative verbatims and quantitative variables (multiple-choice questions, dates, demographics, geo-data, topics, sentiment, and scores). Every report help you pinpoint friction across the customer journey, understand root causes, and slice and dice with ease.
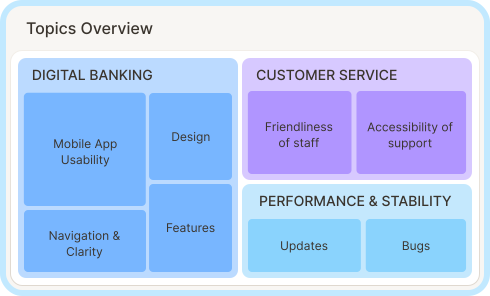
Get the full picture in seconds
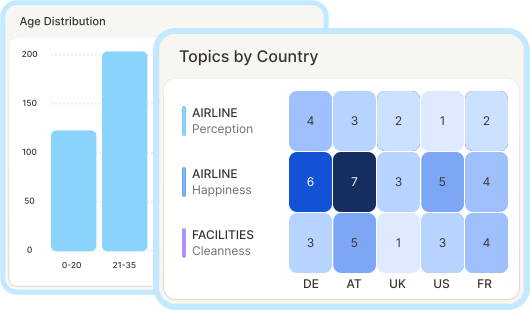
See any topic from any angle
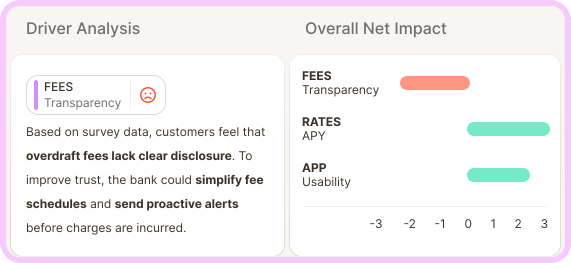
Know what's really moving your KPIs
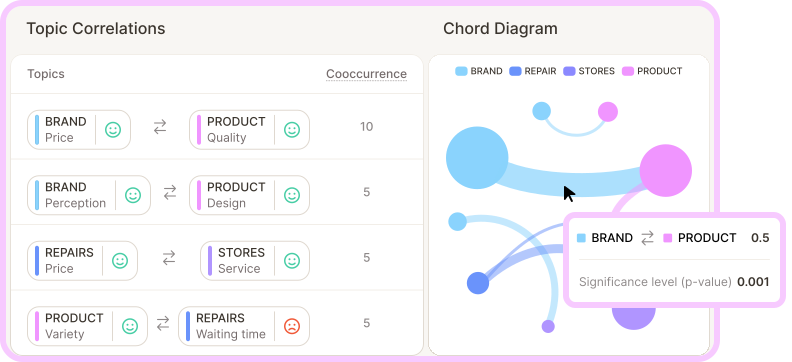
Spot relationships at a glance
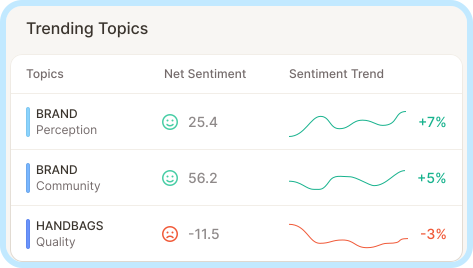
Track what's changing, and against what
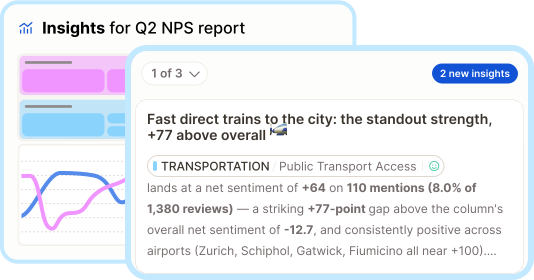
Know before you ask
"Caplena's visualization and reporting capabilities make it easier to communicate findings to stakeholders and support data-driven decision-making.
Go to Customer StoryCaplena's visualization and reporting capabilities make it easier to communicate findings to stakeholders and support data-driven decision-making.
From feedback to action-ready dashboards
How Caplena reports work step-by-step
Bring your feedback from anywhere, via import or integrations. After you code topics and sentiment with Caplena, and maybe create a few Smart Columns, you're ready to create a report.
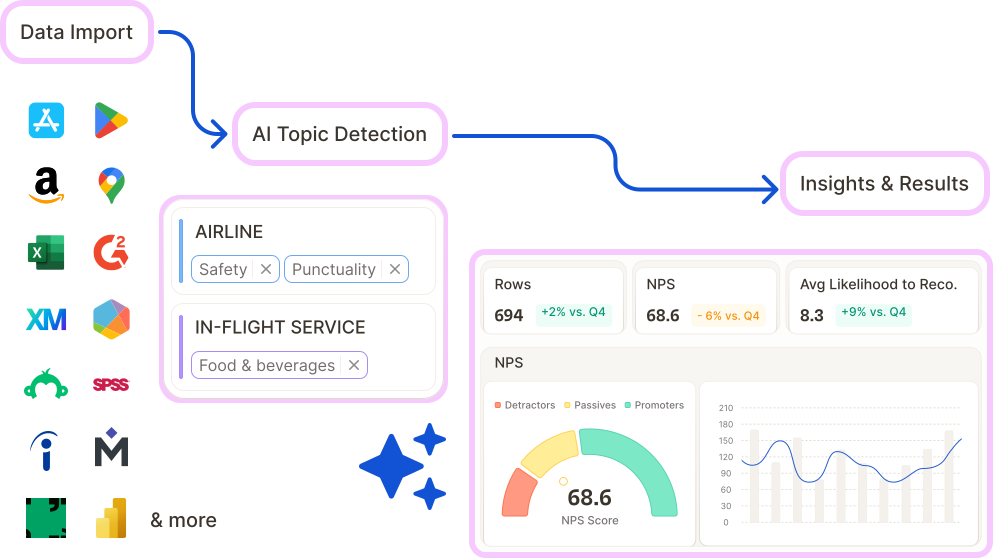
You shouldn't spend time building a dashboard from scratch. Caplena understands your context and turns your raw data into a stakeholder-ready report, using your brand theme, with the relevant segments, filters and view, in about a minute.
Use it as-is, or refine it.
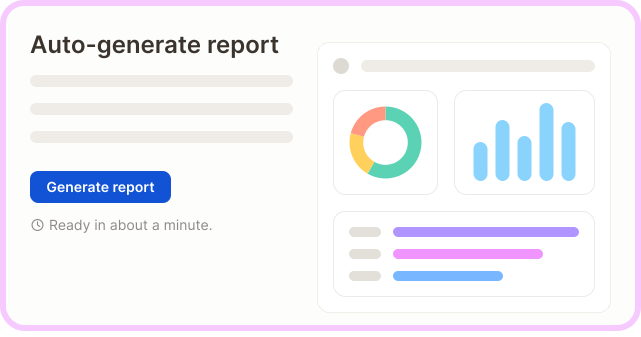
Add or remove insight elements to reveal more findings. Adjust or create segments for filtering or comparison. Rename or add views tailored to your stakeholders, apply your own branding and color scheme.
What Caplena drafted is a starting point. The report you share is as customized as you want it to be. And Insight Agent remains a click away to help you dig deeper or perform actions like creating a segment so you can move faster.

Reports can be shared with unlimited users at no extra cost so everyone can use insights and make data-driven decisions.
Fast-loading, interactive dashboards show the topics customers or employees talk about most, sentiment, trends and instant summaries at a glance.
Anyone can explore them by drilling all the way down to the comments, while Insight Agent stays just a prompt away to dig deeper, explain a trend, and return precise quantitative and qualitative analyses.
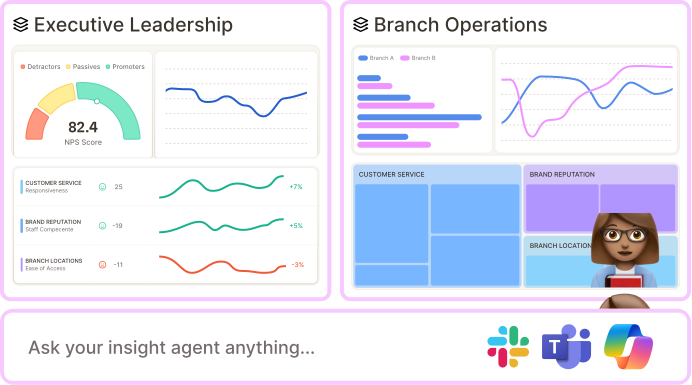
Insight Agent doesn't wait to be asked to let you know where to act.
It continuously looks for shifts in sentiment, root causes, emerging topics as they happen, and surfaces it inside your reports so you find out what's relevant before you even ask.
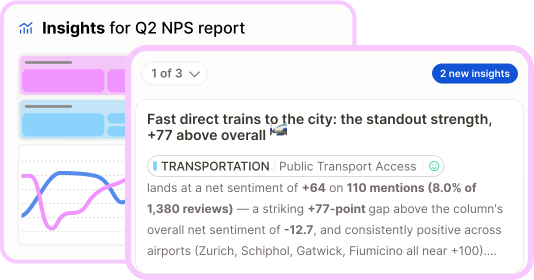
Finding an insight shouldn't be the end of the story.
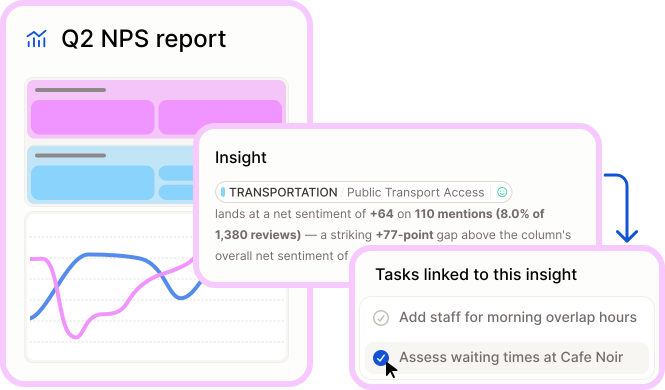
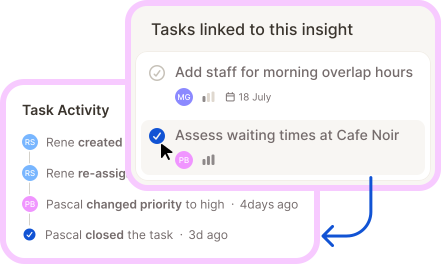
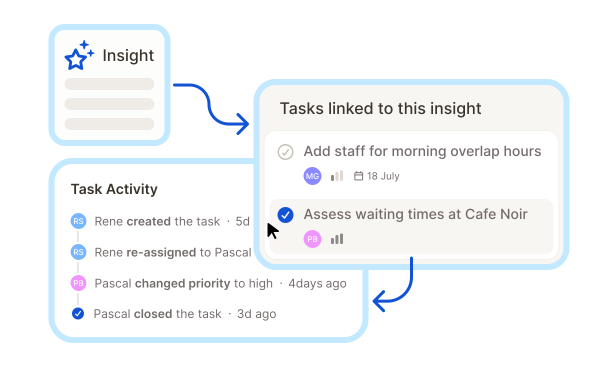
With Caplena, you can turn any insight into a task so exploring doesn't stop at sharing the numbers. Assign the task to the right team member and finally close the gap from insight to action.
Explore Faster, Act Smarter.
Have a question? Just ask.
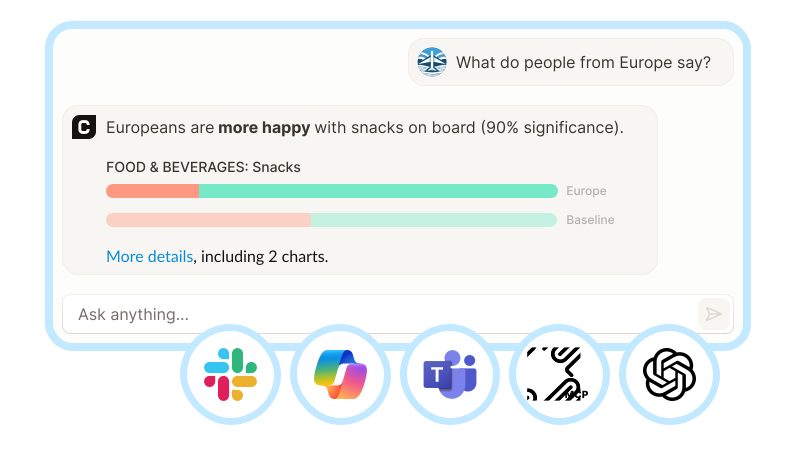
Insight Agent sits inside every report, ready to explain a number, dig deeper with a follow-up question, or take the next step itself.
Inside Caplena, it answers questions and admins can ask it to execute tasks like creating a segment, a topic, or a Smart Column
Outside Caplena, it make your reports data accessible. Ask questions in Slack, send a weekly report to a stakeholder's inbox, trigger alerts in Microsoft Teams, or embed insights into your workflows via the Caplena MCP
See an insight? Take it to the next step.
Exploring is half the job. Acting is the other half. Inside Reports, you can turn insights into tasks to close the loop.
Assign it to yourself or a team member
Select the priority level
Set a due date
Ask Insight Agent to create and assign the task for you, or do it yourself in a click.
Democratize reporting access, without losing control
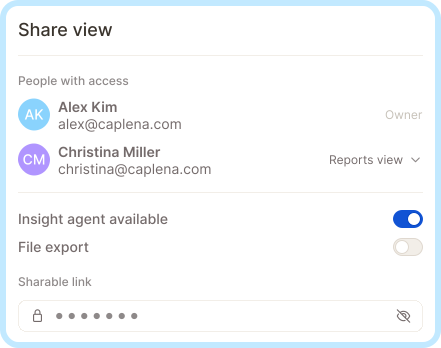
Insights should reach everyone who needs them, not just the people who built the report. To ensure control, Caplena offers fine grained options that meet complex enterprise-grade requirements.
Grant teammates view or edit access, share externally via password-protected and expiring links, or set a filtered report view for a stakeholder group. The same granular permissions govern Insight Agent and MCP access, so anyone can ask questions for the data they're allowed to see.
When analyzing customer or employee feedback, ensuring the data privacy and protection is a non-negotiable.
AI-powered, but grounded.
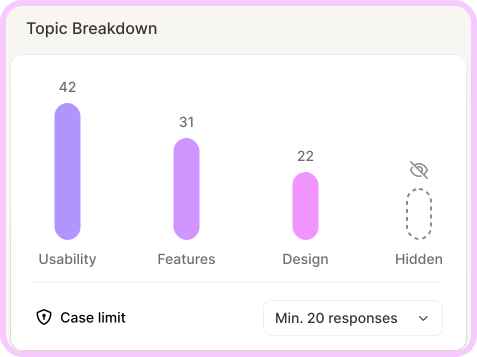
Caplena's reports leave no room for shallow insights. Every number is backed by significance testing, weighting and case logic. Every chart is drillable so everyone can hear the voice of customers and employees.
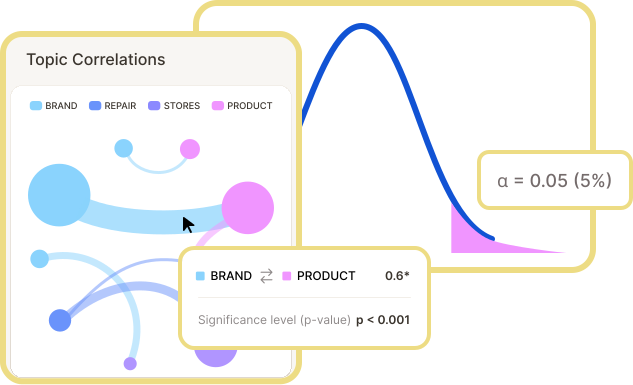
Know what's real, not random
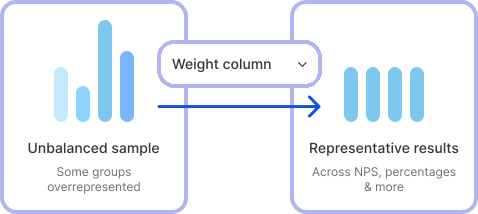
Keep results representative, automatically

Hear the voice of customers & employees directly