How to Keep Large-Scale Tracking Studies Serving Fresh Insights

Barbara Houdayer
Head of MarketingLarge-scale tracking studies, from NPS and post-purchase trackers to brand perception surveys, can gather thousands or even millions of responses over time. At their best, they become the recipe books for customer understanding: what customers keep coming back to, what leaves a bad taste, and which patterns the business should act on.
At enterprise scale, that recipe book gets super tricky to maintain. Every wave adds new text comments, markets, languages, and stakeholder questions. The topic collection that worked so well just a few months ago can start hiding what matters today: a new service issue buried under a legacy topic, a regional pattern flattened by global reporting, a niche complaint that never becomes visible until it has already reached the board deck.
"Corporate organisations love stable trackers, yet this remains one of the biggest challenges in the field of CX insights. To capture the right topics and be responsive to customers' challenges, we need to continuously improve our approach without creating too much fluctuation across the organisation."
Corporate organisations love stable trackers, yet this remains one of the biggest challenges in the field of CX insights. To capture the right topics and be responsive to customers' challenges, we need to continuously improve our approach without creating too much fluctuation across the organisation."
Tim Stierman
Digital Product Leader Global CX Platform @ IKEA
And that’s the risk with large trackers. They have the scale to hold the signal teams need, while the structure around them makes that signal harder to see. So the goal is simple: improve the recipe without interrupting service. Right? Keep the tracker fresh, keep reporting stable, and make sure new customer signals do not get buried in yesterday’s menu. Let’s cook.
Scores show movement.
Text comments explain what happened.
NPS, CSAT, post-purchase scores, and brand tracking metrics all show movement. They tell you if something improved, dropped, or stayed flat. For CX and brand health monitoring, that movement is the finished plate. The open-ended feedback shows what happened behind the scenes.
A score might show that satisfaction dropped after a flight, a purchase, a store visit, or a cruise. The text comments can show if customers were frustrated by delays, unclear communication, staff behavior, product availability, cleanliness, food quality, or something much more specific.
Scores show that something changed. Open-ended responses show why. They capture insights outside the scope of quantitative questions, helping teams spot emerging topics, sharper pain points, and customer language that fixed rating scales can miss.
Lufthansa is a strong example of this. Their feedback analysis combines NPS with open-ended questions across ground operations, in-flight service, and brand perception. With Caplena, the Lufthansa team analyze over 600,000 pieces of feedback annually across more than 600 detailed topics. These insights feed into an internal Insights Hub used by more than 1,000 employees.
At that scale, broad topics only get you so far. A topic like “Punctuality” can show that delays are affecting the customer experience. But the action often sits one layer deeper: were customers frustrated by the delay itself, or because they did not feel informed while they waited? That second version gives the team a clearer problem to solve.
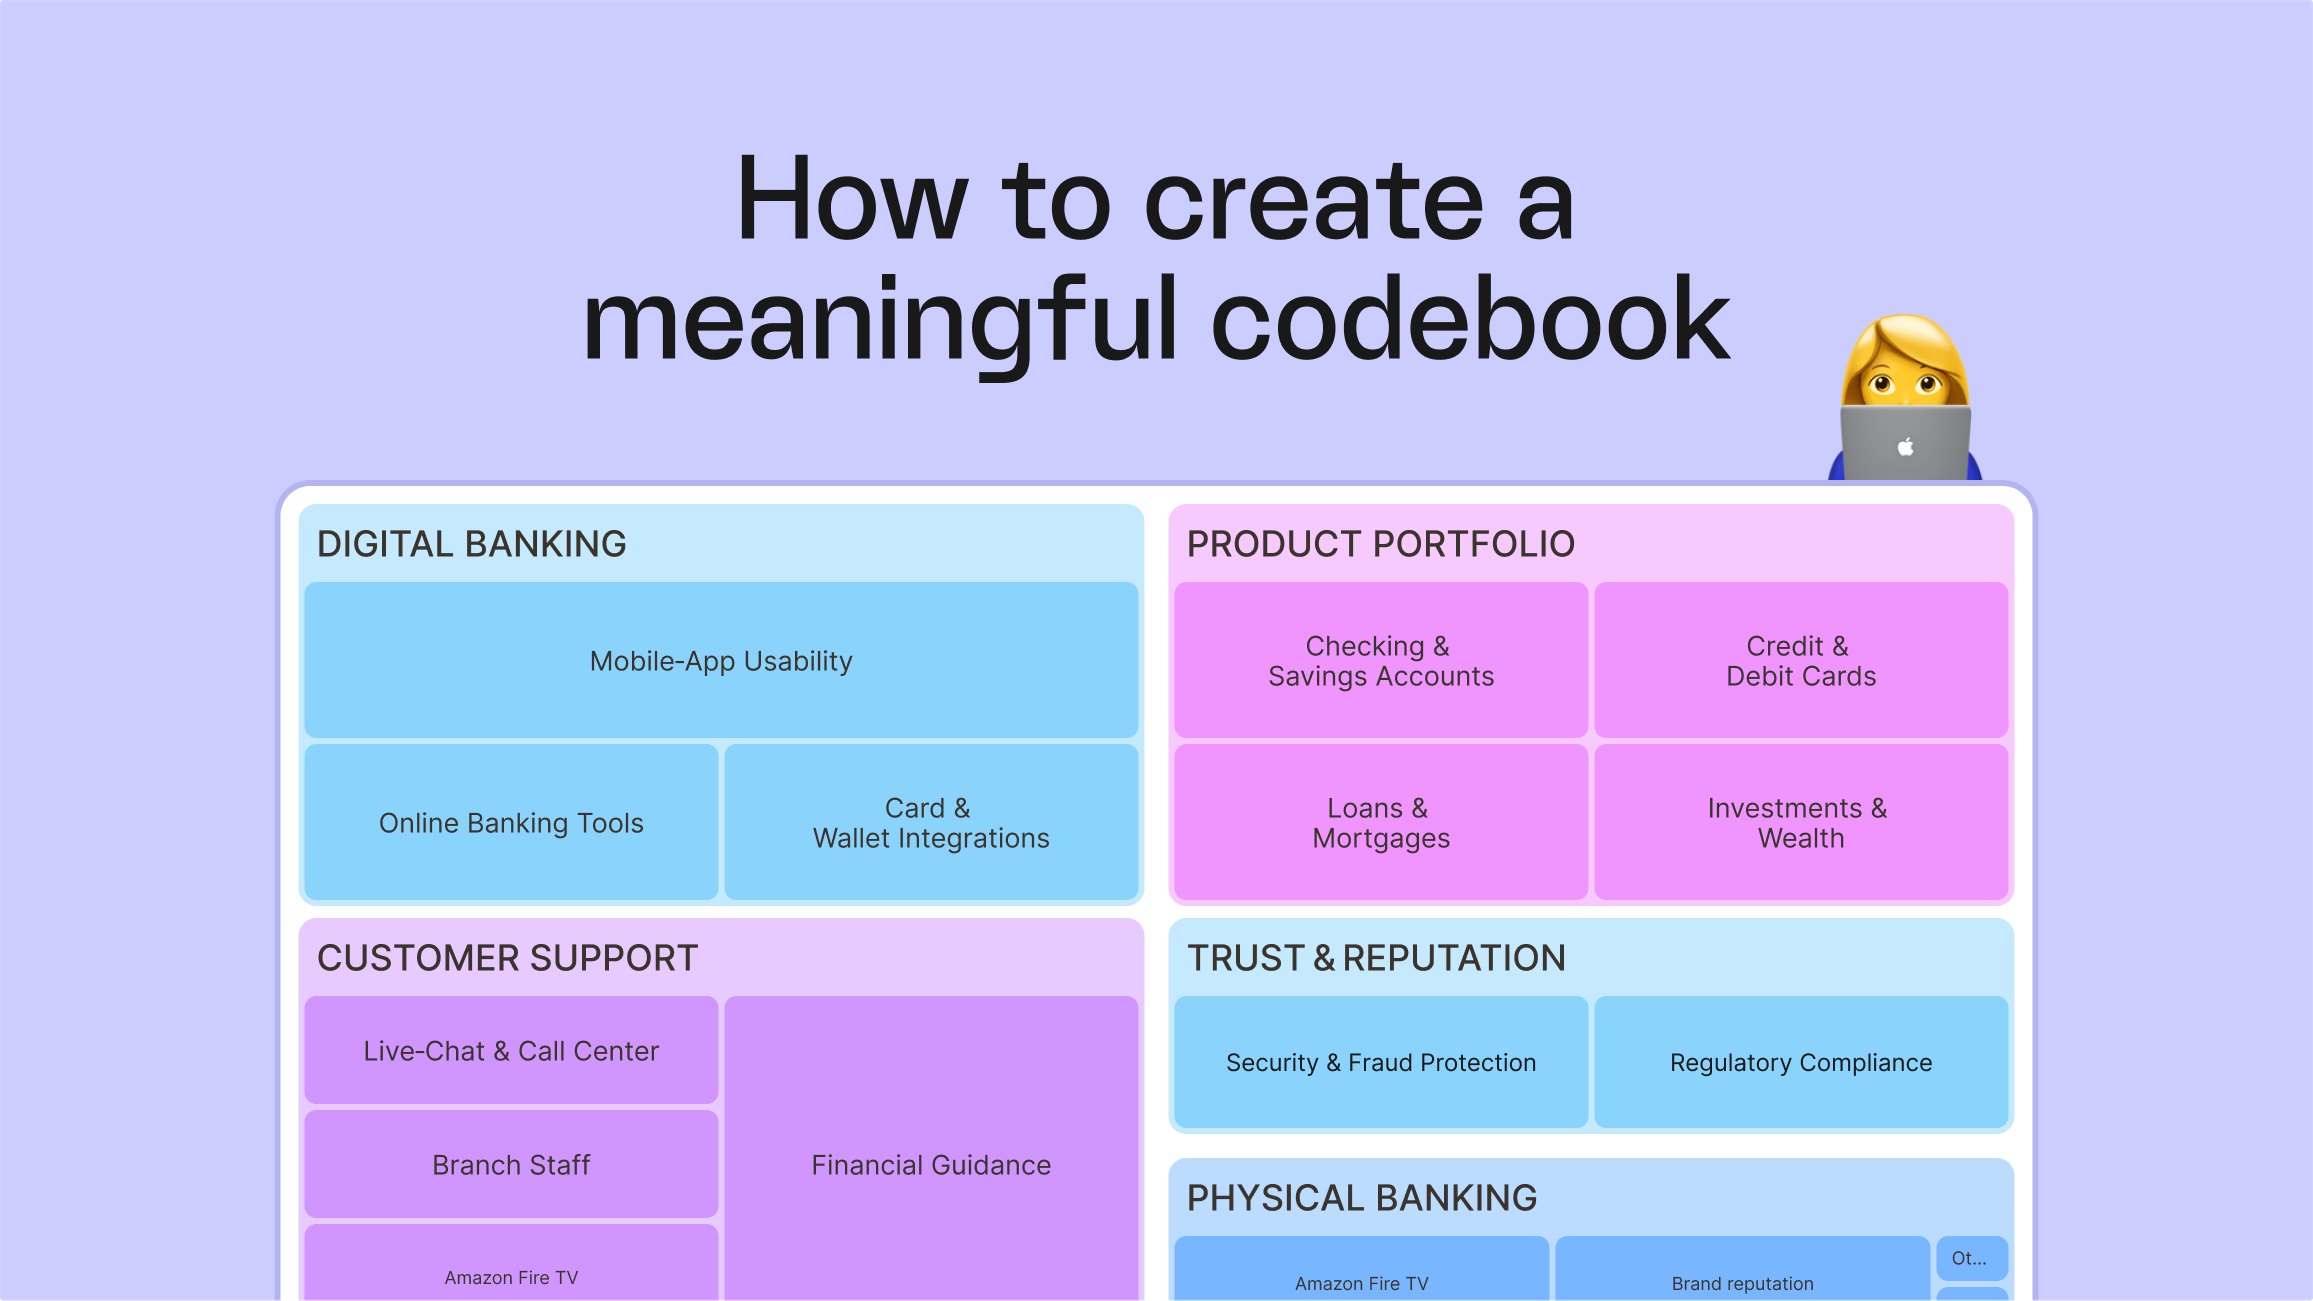
When the recipe book gets too big, maintenance becomes the hard part
Large trackers have to stay comparable across survey cycles while still reflecting how customers talk about their experience now. That’s where the recipe book needs careful editing.
As the tracker matures, the recipe book starts needing careful upkeep. New issues appear, some topics become too broad, and others need merging, splitting, renaming, or clearer descriptions. Add market-specific language and more precise stakeholder questions, and every change has to improve the menu without making yesterday’s reporting impossible to explain.
IKEA shows what this looks like at scale.
The company analyzes over 3 million feedback comments per month across 40+ languages, with 16,000 employees using Caplena's capabilities worldwide. Before Caplena, IKEA used a lexicon-based method that was labor-intensive and inconsistent across languages. A lot of feedback also landed in a broad “General” category, which hid specific issues such as food quality or wait times.AIDA Cruises faced a similar challenge.
The team moved from sample-based analysis to analyzing over 1.7 million guest comments with confidence, using Caplena alongside Qualtrics. Open-ended NPS follow-up questions help them explain score changes, identify improvement areas, and answer operational questions from onboard services, entertainment, and food and beverage teams.
Customer feedback changes constantly. Large trackers need a safe place to test the recipe before changing the menu everyone uses.
Why you should build a “test kitchen” for your tracker
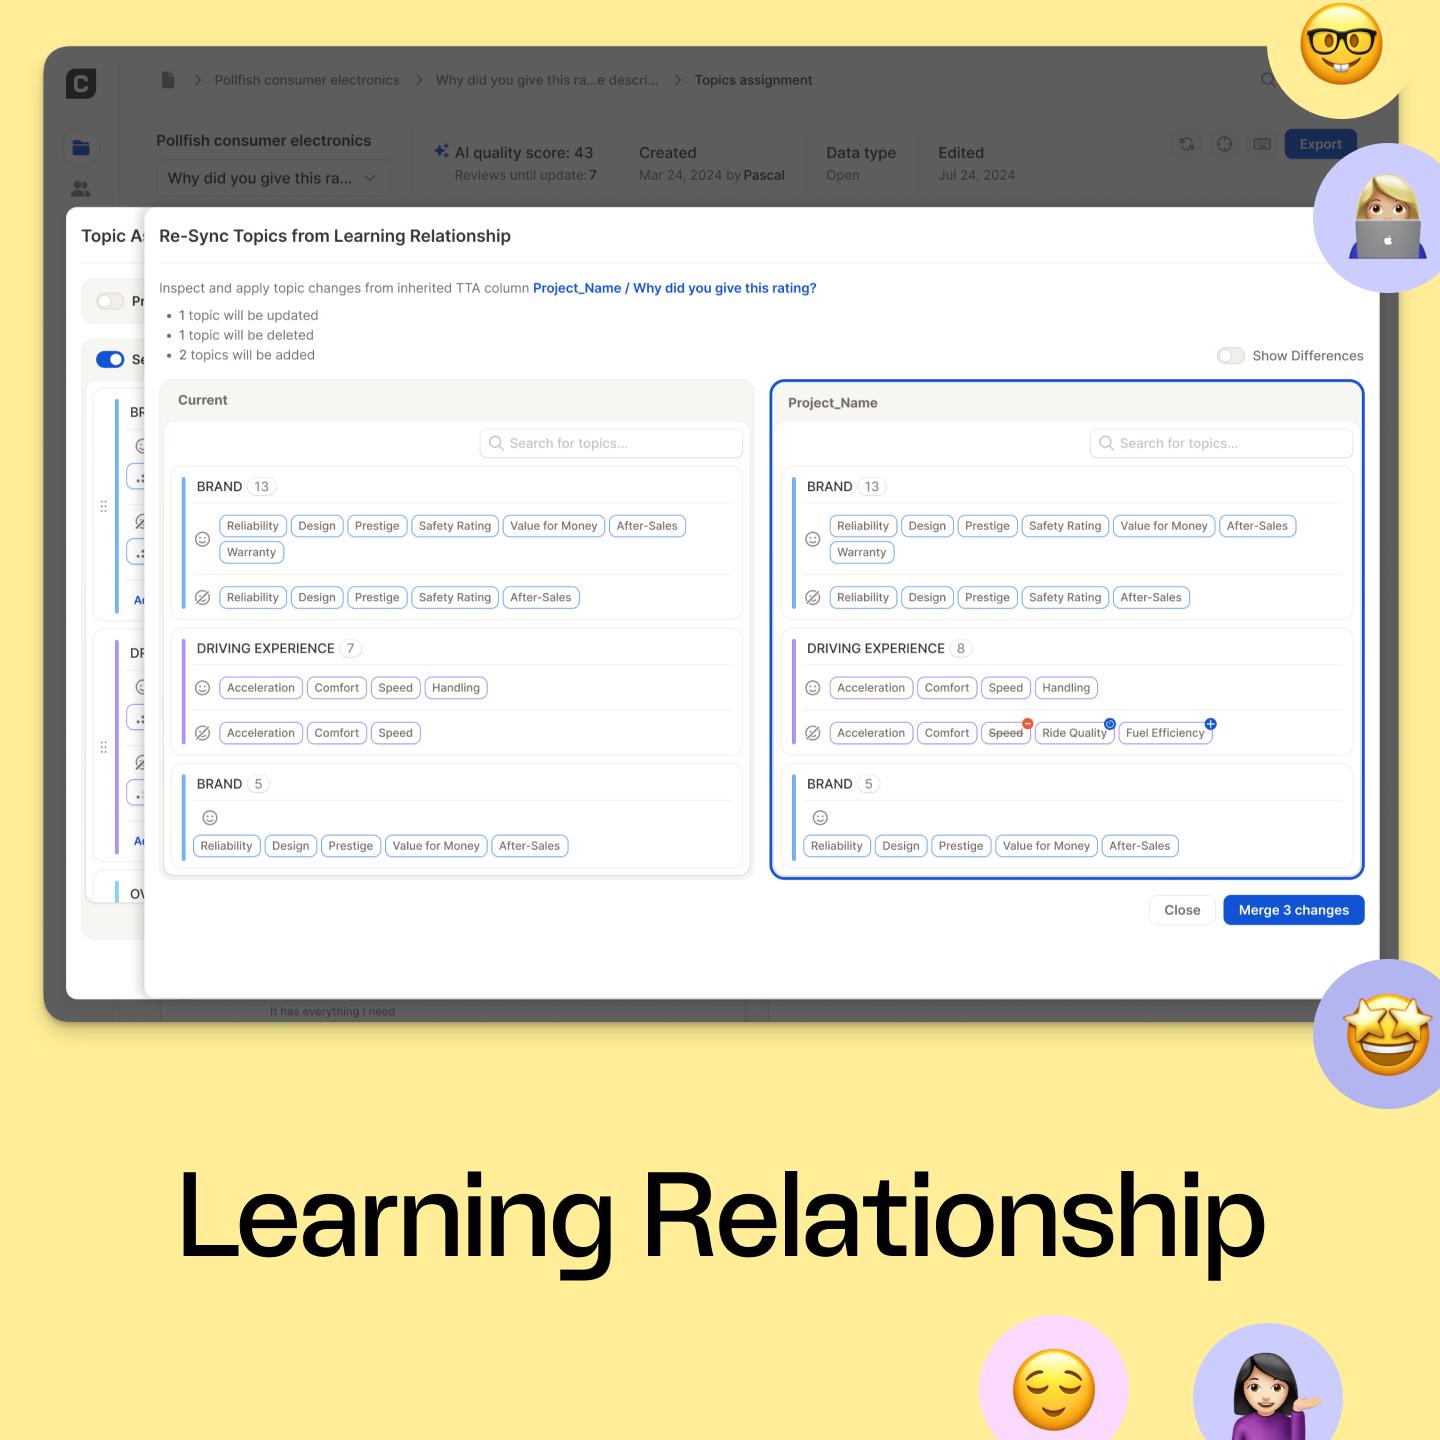
The cleanest way to manage large trackers is to separate the live reporting environment from the experimentation space. In Caplena, that means working with a production project and a development project connected through a learning relationship.
This is the setup CX teams like IKEA's have built.
"The topics that matter to customers today may be different tomorrow. To address this, we introduced a test environment for learning and optimisation before launching changes into production. This allows us to monitor quality and assess the impact on reporting before making updates available to all users."
The topics that matter to customers today may be different tomorrow. To address this, we introduced a test environment for learning and optimisation before launching changes into production. This allows us to monitor quality and assess the impact on reporting before making updates available to all users."
Tim Stierman
Digital Product Leader Global CX Platform @ IKEA
Think of the production project as the live kitchen. It holds the full tracker: all rows, all survey cycles, stakeholder-facing reports, alerts, and ongoing analysis. It should stay stable because people across the business rely on it.
The development project is the test kitchen. It holds a representative sample, for example 20,000 rows. This is where the insights team tests new topics, merges or splits existing ones, adjusts topic descriptions, and fine-tunes AI topic assignment before anything touches live reporting.
| Production project | Development project | |
| Kitchen role | Live kitchen | Test kitchen |
| What it holds | Full tracker: all rows, survey cycles, reports, alerts, and ongoing analysis | Representative sample, for example 20,000 rows |
| What it’s for | Stable, stakeholder-facing reporting | Testing topic changes before they affect live reporting |
| What happens there | Teams monitor trends, compare markets, and share insights across the business | Teams test new topics, merge or split topics, adjust topic descriptions, and fine-tune AI topic assignment |
| Rule of thumb | Keep it stable | Use it to experiment safely |
The learning relationship makes the setup work. Production surfaces real changes in the tracker. Development gives the team space to explore those changes, test them against the existing topic collection, and validate them. Once the update is ready, the learning relationship lets the team push one clean version back into production without rebuilding the analysis from scratch.
"For large-scale CX trackers, your development project is the cookbook: a small, representative sample where you test new topics, merges, splits, and descriptions. Once the recipe works, you apply one validated update to the full production project. It’s faster, more efficient, and gives you a clean audit trail.
For large-scale CX trackers, your development project is the cookbook: a small, representative sample where you test new topics, merges, splits, and descriptions. Once the recipe works, you apply one validated update to the full production project. It’s faster, more efficient, and gives you a clean audit trail.
Maurice Gonzenbach
Co-Founder & Co-CEO
The kitchen roles are useful here. The human analyst is the chef, orchestrating the analysis and deciding what makes it onto the menu. Insight Agent acts like the sous-chef, helping investigate the ingredients, meaning the data, and the recipes, meaning the topics. LLM topic generation is closer to the line cook, preparing candidate topics before they are served to production.
AI helps the kitchen move faster. But humans still own the recipe.
6 Ways to improve your recipe without disrupting service
Once the setup is in place, new patterns get a clear path from discovery to validation to production. That path is important because large trackers feed many decisions. A small topic change can affect trend lines, reports, alerts, and ultimately stakeholder trust.
This workflow keeps experimentation active without turning the live tracker into a test kitchen.
1. Keep the live kitchen stable
Treat the production project as your one source of truth. It holds the full dataset, recurring survey cycles, stakeholder-facing reports, and live alerts. This is where teams monitor performance, compare markets, track topics over time, and share insights across the business.
Production should reflect validated analysis. New ideas are welcome, of course, but they need to go through the right process before they affect live reporting.
2. Watch for new ingredients
As new survey cycles arrive, alerts and reports help teams identify emerging issues. This could be a topic crossing a threshold, a sudden change in sentiment, or a recurring theme becoming more common in one market, journey, or customer segment.
These early signals matter because tracker changes often start quietly. A local service issue, a new complaint type, or a shift in customer expectations may already be visible in the open ends before the overall score moves.
3. Taste before rewriting the recipe
Before adding a new topic, analysts should check if the pattern is real, specific, and worth tracking. Insight Agent and LLM topic generation help here. Analysts can ask follow-up questions, inspect niche patterns, and see whether a new issue deserves a permanent place in the tracker.
Exploration helps the team move from broad topics into the smaller moments that explain the experience. It helps analysts decide whether a new issue belongs in the recipe book, or whether it is just a one-cycle special. Not every interesting signal needs a permanent place on the menu.
"We have around 600 codes, but we can’t capture every nitty-gritty topic, especially when we’re constantly testing new things across airlines. With Insight Agent, we can quickly explore niche questions, like whether delayed passengers felt informed while they waited.
We have around 600 codes, but we can’t capture every nitty-gritty topic, especially when we’re constantly testing new things across airlines. With Insight Agent, we can quickly explore niche questions, like whether delayed passengers felt informed while they waited.
Sarah Boesch
Principal Customer Insights Analyst
4. Test the new dish in development
Once a new pattern looks promising, move it into the development project. This is where the team checks whether the new topic still works within the existing topic collection.
Does it overlap with another topic?
Is it too narrow? Is it too broad?
Does it work across languages?
Does it help a stakeholder make a better decision?
Will it still make sense three survey cycles from now?
The development project gives analysts space to test without creating noise for everyone using the live reports.
5. Battle-test the categorization
In the development project, the team reviews topic assignments, corrects edge cases, adjusts topic labels, improves topic descriptions, and merges or splits topics where needed. This is the human-in-the-loop quality control stage.
AI Quality Score helps the team understand whether the AI is assigning topics well enough to go live. Topic generation can suggest overlapping, rare, or emerging topics, but the team decides what belongs in the final structure. The update should only move to production once the categorization has been battle-tested.
That quality check becomes especially important when the tracker supports many teams, markets, and operational decisions. FlixBus analyzes more than 800,000 open-ended post-ride survey responses per year across 45 countries, using the results alongside NPS to guide decisions across operations, country management, network planning, and leadership. At that scale, topic assignment needs to be precise enough to support real improvements, from punctuality to delay communication.
That’s the sweet spot: AI helps manage the scale, but the insights team keeps control over the recipe that guides business decisions.
6. Send one validated update back to production
Once the topic change has been tested and refined, push one consolidated update into production. The live tracker receives deliberate improvements the team can explain now and in the future, rather than many small edits that are hard to trace.
This is crucial for auditability. The development project shows how the recipe was tested. The production project shows which version made it onto the menu. So when someone asks, “Why did this topic change in Q3?”, the answer is clear. No mystery ingredient. No digging through old prep notes. No “I think Martin changed the recipe before he went on holiday.”
Keep the menu fresh, keep the reporting stable
A production+development workflow gives large trackers stable reporting and active learning. Analysts can keep improving the topic collection without putting stakeholder-facing reports at risk.
That makes tracker governance a business issue, not just an analysis setup. When new customer signals stay visible, teams can act faster, prioritize better, and keep CX decisions grounded in what customers actually say. And the data supports this business-case, too: Forrester found that customer-focused companies report 41% faster revenue growth, 49% faster profit growth, and 51% better customer retention than others.
The workflow also keeps experimentation cost efficient. Many AI solutions are credit- or token-based, so testing every change on the full tracker can get expensive fast. A representative sample lets teams experiment quickly, battle-test the update, and apply only the proven version to the full dataset.
That is how large CX and brand trackers stay useful: production keeps reporting stable, development gives analysts room to refine, and the learning relationship moves validated changes back into the live tracker. The result is a tracker the business can trust, and one that keeps up with what customers are really saying. The best teams keep service running while the recipe gets better. That’s how large trackers keep serving fresh insights without burning down the kitchen.
Do you want to see how this would work for your tracker setup?
Book a call to request a complimentary proof of concept, or explore the Caplena Product Tour
Related blog posts
Everything You Need to Know About The Job Market After Covid 🦠
In the last two years, our work practices have undergone some significant changes. At the present time, there appears to be an increase in the number of job switches. This article examines the reasons for this by analyzing various studies – as well as our own in-house survey.
6 Things That Make Christmas Markets so Irresistibly Christmassy
What are the most common things people mention when they talk about their most recent Christmas market visit? To find out, we studied three highly rated – but different – Christmas markets to analyze their Google reviews.

Customer Review Champion: Adidas vs Nike
Who is the GOAT, Messi or Ronaldo? Are you a Derrick Rose or LeBron James fan? Do you prefer Collin Morikawa or Rory McIlroy? Depending on your answers, it is likely we could predict your favorite footwear brand. How?
How to Collect Surveys and Conduct Feedback Analysis in 1 Day
The research world is like a toolbox. Within the toolbox are surveys, focus groups, and experiments. Recently, the size of this toolbox has increased with social media, internet-based surveys, and mobile phones being used more frequently...
Five Guys’ Marketing Strategy: A Customer Review Analysis
Five Guys caters to burger lovers seeking high-quality food and friendly service – all while keeping things simple. To understand how Five Guys operates its successful marketing strategy, we analyzed 1,236 Google Maps reviews using the text analysis tool, Caplena.
Analyzing Netflix Open-Ended Feedback: A 3½-Step Video Tutorial
This tutorial is all about Netflix! : We’ll take you through every step required to evaluate your open texts with the help of AI. If you follow the 3 required steps described in the guide below in all detail, it will take you approximately 45 minutes to get to achieve these results.
Everything You Need to Know About The Job Market After Covid 🦠
In the last two years, our work practices have undergone some significant changes. At the present time, there appears to be an increase in the number of job switches. This article examines the reasons for this by analyzing various studies – as well as our own in-house survey.
6 Things That Make Christmas Markets so Irresistibly Christmassy
What are the most common things people mention when they talk about their most recent Christmas market visit? To find out, we studied three highly rated – but different – Christmas markets to analyze their Google reviews.
Customer Review Champion: Adidas vs Nike
Who is the GOAT, Messi or Ronaldo? Are you a Derrick Rose or LeBron James fan? Do you prefer Collin Morikawa or Rory McIlroy? Depending on your answers, it is likely we could predict your favorite footwear brand. How?
How to Collect Surveys and Conduct Feedback Analysis in 1 Day
The research world is like a toolbox. Within the toolbox are surveys, focus groups, and experiments. Recently, the size of this toolbox has increased with social media, internet-based surveys, and mobile phones being used more frequently...
Five Guys’ Marketing Strategy: A Customer Review Analysis
Five Guys caters to burger lovers seeking high-quality food and friendly service – all while keeping things simple. To understand how Five Guys operates its successful marketing strategy, we analyzed 1,236 Google Maps reviews using the text analysis tool, Caplena.
Analyzing Netflix Open-Ended Feedback: A 3½-Step Video Tutorial
This tutorial is all about Netflix! : We’ll take you through every step required to evaluate your open texts with the help of AI. If you follow the 3 required steps described in the guide below in all detail, it will take you approximately 45 minutes to get to achieve these results.