How to Analyze Open-Ended Survey Responses: A Human Experiment

Barbara Houdayer
Head of Marketing
If you’ve ever opened a spreadsheet with thousands of open-ended survey responses and thought, “there goes my week,” you’re not alone.
But those answers hold real value. And yes, you can definitely get to it. Even for the most experienced insights teams and market research agencies, supported by enterprise-grade tools, turning free text into real insights is rarely a simple task. But luckily, there’s more than one way to do it right. Here’s how.
Understanding Open-Ended Survey Responses
Open-ended surveys are used to gather customer and employee feedback, allowing people to answer questions in their own words rather than choosing from predefined answer choices, as is the case with closed-ended questions (e.g., 1–5 or Yes/No). Open-ended survey questions — also called open questions — do not provide answer choices, while cosed-ended questions offer predefined options for respondents to select.
There are different types of survey questions, including open-ended and closed-ended, and each type serves a distinct purpose in research: open-ended questions capture qualitative insights and detailed explanations, while closed-ended questions provide easily quantifiable data.
When desigining open-ended survey questions, use simple, plain language, avoid leading or double-barreled questions, and use specific prompts such as 'What.' 'How,' or 'Why' to encourage detailed respones. Consider making open-ended questions optional to reduce survey abandonment, and limit their number to avoid respondent fatigue. Starting surveys with closed-ended questions can help ease respondents into the context before introducing open-ended questions. Pilot testing your survey on a small group helps ensure clarity, and using larger text boxes can encourage more detailed responses. Closed-ended questions can be used to identify sentiment, followed by open-ended questions to understand the reasons behind those sentiments.
Open-ended responses are what we also call unstructured data, making up 80–90% of today’s global data. Analyzing it is tricky, but once you’ve learned how to do it, you’ll be happy you did (and so will your business).
Why Qualitative Analysis Matters
Quantitative metrics tell you what’s happening, but open-ended survey responses capture participants’ opinions and perspectives, providing context that quantitative data alone cannot offer. These responses offer the nuance behind the score, the emotion behind the churn, and the friction behind the drop-off — all in the respondent’s own words. However, qualitative data from open-ended responses is often messy, containing typos, slang, and varying lengths of responses, which complicates the analysis process.
While open-ends are often part of quantitative surveys, they come in an unstructured, qualitative form. Analyzing them means converting that free text into structured, quantifiable insights. Without the right approach, you can be left with a biased, incomplete, or error-prone analysis. If you’re doing it right, though, the real value of open-ended responses lies in their ability to help researchers draw meaningful conclusions by integrating qualitative insights with quantitative data, adding a ton of depth, clarity, and speed to decision-making.
Why You Should Quantify Your Open-Ended Data
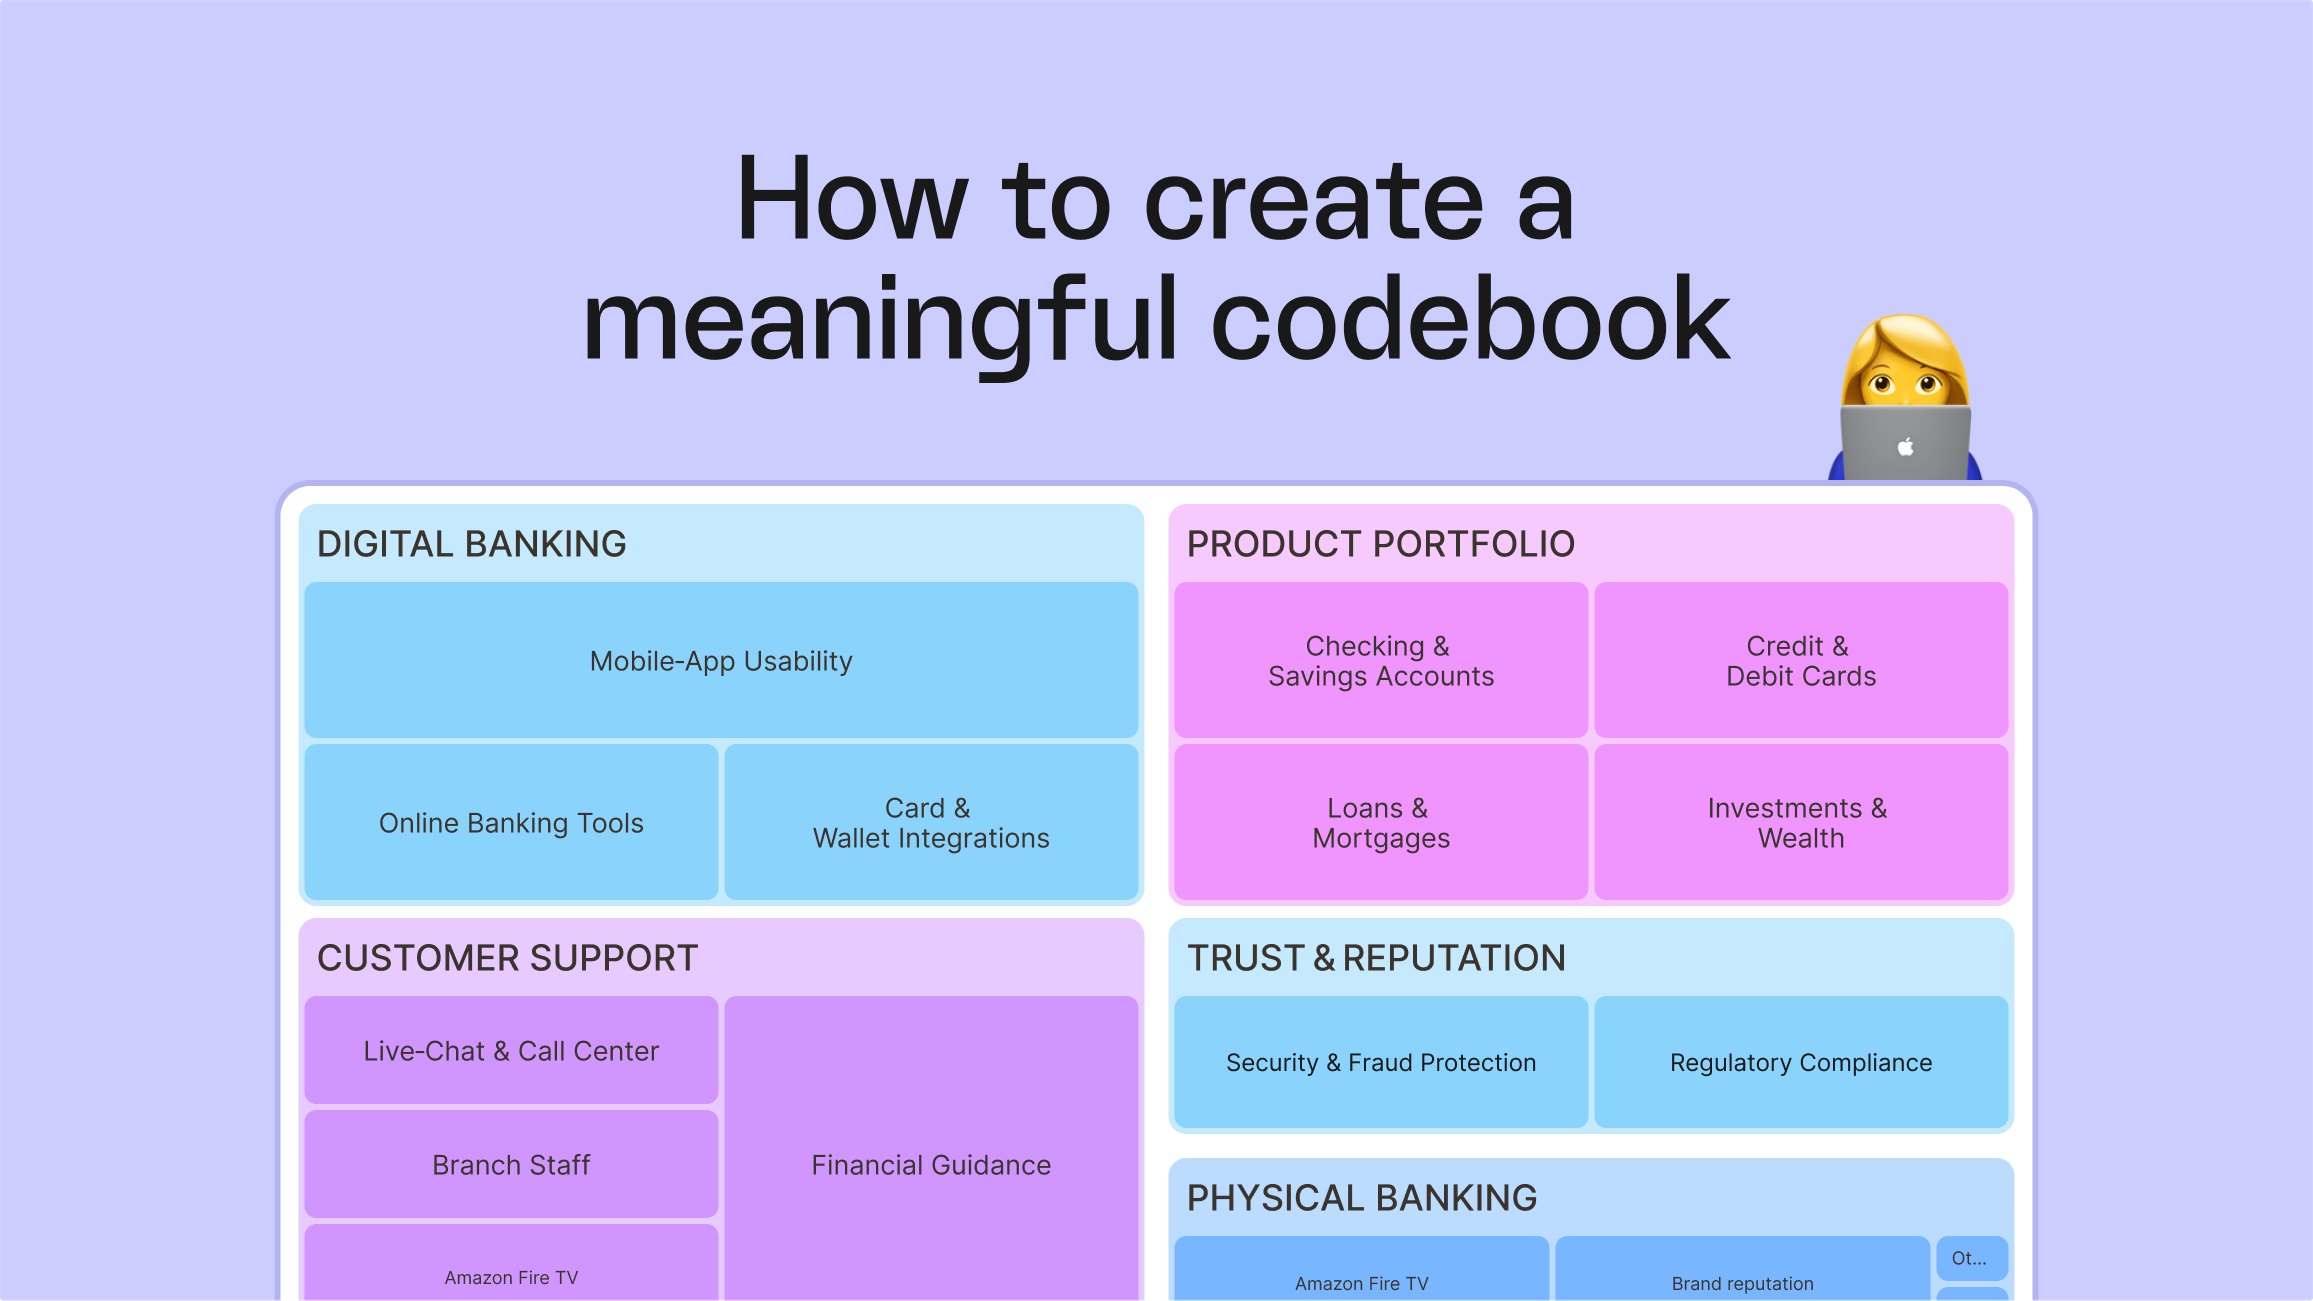
Open-ended feedback is unbiased, rich, and unstructured. The first step in analyzing open-ended survey responses is to review the raw data from survey respondents and begin the coding process, where responses are systematically categorized into themes. This systematic coding process helps transform unstructured feedback into actionable insights. Without being confined to pre-defined options, respondents can share what’s truly top of mind for them, often revealing nuanced perspectives that don’t fit neatly into simple positive or negative categories. This makes it powerful, but also hard to use. That’s why quantifying it matters so much. Quantifying means assigning structure: tagging responses with topics, themes, and sentiment.
When done right, this lets you say how many people mentioned something, how they felt about it, and how that changed over time. It bridges the gap between messy comments and metrics your stakeholders can act on. In other words, you’re not just collecting feedback, you’re turning it into evidence. That’s the difference between a three-star review and “24% of passengers on Route A complained about flight punctuality in April.”
Open-ended responses don’t just give you quantified evidence but help you better understand your customers. While structured data tells you “what” happened, free-text responses tell you the “why” behind customer behaviors, preferences, and pain points. These are insights that might have never surfaced through multiple-choice questions alone.
7 Challenges with Open-Ends
Turning open-ended feedback into insights sounds simple, until you’re doing it at scale. Between the volume, the variability, and the internal pressure to deliver results fast, a lot of teams, both in-house and through agencies, run into the same types of problems. The subjective interpretation of open-ended responses can result in inconsistent analysis outcomes, as different analysts may group similar responses differently or categorize the same response in various ways.
This becomes especially clear when looking at a real customer review. Just by analyzing this one example, we can see how challenging it can be to properly review and categorize open-ended responses.
Challenge #1 - Interpretation is subjective 🤔
Two different analysts can read the same comment e.g. “Landing was only an hour late. No worries” and tag it differently. That might be okay for small teams. But it doesn’t scale across markets, departments, cultures, or time zones.
Challenge #2 - Qualitative data is messy 🙃
Responses come in all forms: typos, slang, novels, sarcasm, emojis, long rants, or single-word answers. Even the best of models struggle to interpret meaning without context, e.g., “The best is the food.”
Challenge #3 - The process is time-consuming 🥵
Cleaning, tagging, and organizing thousands of comments takes serious effort. With large datasets, it’s a matter of days, not hours.
Challenge #4 - Manual tagging is inconsistent 😅
Reading and labeling by hand leads to fatigue, inconsistency, and errors. This is especially true when responses raise several conflicting points.
Challenge #5 - You risk missing what matters 🫠
Without structure, it’s easy to overlook key patterns. A product issue, a recurring frustration, a critical signal can easily get buried under generic summaries like “mostly positive.”
Challenge #6 - Trust in AI is still limited 🫤
Generative tools like ChatGPT help with summarizing and suggesting themes. But without transparency or control, many teams hesitate to use LLMs for high-stakes insights.
Challenge #7 - Most tools aren’t built for it 😢
General-purpose feedback tools and BI platforms handle structured data well. But qualitative feedback needs different workflows, visualizations, and logic. Most teams are still patching that together manually.
The method you choose in doing this makes all the difference in what you learn, and how fast you get there. That’s what we’ll unpack next: four ways to analyze open-ended survey responses, from fully manual to fully automated. You’ll see what each option looks like in practice, and where a platform like Caplena fits in.
4 Ways of Analyzing Open-Ended Survey Data
Across hundreds of teams — from fast-moving startups to global enterprises — we’ve seen four common approaches to analyzing open-ended feedback. One of the most common methods is thematic analysis, which involves a systematic coding process to organize open-ended survey responses into meaningful categories and draw insightful conclusions from the data. These aren’t theoretical. They’re the methods real teams are using every day to extract insight from qualitative data.
Modern survey software often leverages AI and text analytics to automatically group concepts, detect topics, and categorize answers, while sentiment analysis can categorize text by emotional tone, such as positive, negative, or neutral, to gauge participant or customer feelings. Additionally, word clouds are a popular way to visualize the frequency of themes in open-ended responses, making qualitative data more accessible and easier to interpret. Integrating quantitative data with qualitative insights from open-ended responses can provide a more complete and nuanced understanding of survey results.
Some approaches are quick. Some are customizable. Some deliver impressive results. Others require a bit more pain tolerance. Let’s break them down.
Option 1: Manual Analysis
This is still the most common approach. Manual analysis involves a detailed coding process, where analysts export responses to a spreadsheet and systematically group similar responses into themes. This process includes tagging sentiment and building a taxonomy from scratch. It gives you full control and close contact with the data, which can be useful for small projects, around 100-200 responses. But it doesn’t scale. It’s time-consuming, error-prone, and quickly becomes unsustainable as volumes grow.
Option 2: AI Assisted Analysis
Many teams now experiment with large language models (LLMs) like ChatGPT or Claude to summarize and tag responses. AI-assisted analysis often includes sentiment analysis to categorize responses by emotional tone, helping teams quickly identify positive, negative, or neutral feedback. It’s fast and flexible — great for getting a high-level overview or exploring early-stage patterns. But without structure or oversight, the output can be misleading, and accuracy often drops off with larger datasets of 500+ responses. It’s a useful starting point — just not something you’d want to base major decisions on.
Option 3: Building Your Own Tool
For teams with strong internal AI capabilities, building a custom tool can offer complete ownership — tailored to your specific requirements, workflows, and integrations. But it’s a heavy lift. You’re not just building; you’re maintaining — which means ongoing updates, retraining, approvals, and technical debt. The trade-off: full control comes with high cost and complexity.
Option 4: AI-powered SaaS (Like Caplena)
Purpose-built platforms like Caplena offer a faster, more scalable path to insight. Leveraging AI & Text Analytics, these AI-powered SaaS solutions automatically group concepts, detect topics, and categorize answers, integrating both qualitative and quantitative data for richer insights. Designed specifically for the analysis of open-ended feedback, they combine automation with unparalleled speed of analysis. They give teams multilingual support, customizable topic categories, and advanced data visualization. It’s enterprise-ready without the overhead of building from scratch.
What Leading Brands Have Already Figured Out
Most companies, still to this day, choose the traditional way of doing it. Leading brands, however, recognize that the real value of open-ended survey responses lies in their ability to help draw meaningful conclusions from customer feedback. That was also the case for multinational tech company, Bosch. They used to analyze their own open-ended responses this way, too. And just like for most of us, the challenge for them wasn’t really about collecting the feedback. It was rather about making sense of it.
"We had over 100,000 open-ended responses, and our biggest challenge was to somehow cluster them. It was a lot of manual work.”
We had over 100,000 open-ended responses, and our biggest challenge was to somehow cluster them. It was a lot of manual work.”
Marian Hoffmann
Data Analyst, Bosch Comfort Home
Nowadays, Bosch Comfort Home is using Caplena’s AI-powered feedback analytics (and have seen their NPS score improve from 18 to 52). And, sure, we obviously believe that we’ve got the best solution for analyzing open-ended survey responses. But it’s definitely not the only one.
Now let's compare the different ways of actually analyzing it (from spreadsheets to AI).
Lukas vs 9480 Rows of Data: A Human Experience
To test the four options, we had our good friend, Lukas (not a Caplena employee, but an unbiased person with a healthy curiosity for both data and AI), analyzed 9480 rows of real, open-ended customer feedback provided by survey respondents. These participants shared their opinions and ideas about their experiences, offering valuable qualitative data for analysis using our four options from above.
We looked at the approach Lukas took with each option, tracked how long each one took, where challenges appeared, and how reliable the results turned out to be. We hope that Lukas’ experience will help you get a better idea of what option might be the right one for you.
About the Dataset
The dataset used in this experiment comes from real-world airline reviews submitted for the World Airline Awards, an annual ranking by Skytrax, based on global passenger feedback. It includes 9480 open-ended responses from survey respondents (participants) who shared their opinions and ideas on topics like service quality, in-flight experiences, and delays. This makes it a great test case for analyzing large-scale, unstructured survey data.
Option 1: Manual Analysis
Lukas began the same way many teams do — with a spreadsheet and a plan: to read the reviews, tag the themes, and structure the data. Manual analysis like this requires a detailed coding process to systematically group similar responses into themes, which can be time-consuming and challenging as the volume of data grows. But the volume caught up fast, and after just 20 minutes, Lukas only made it through 15 entries. So instead, Lukas decided to try sampling the data.
"I figured that, by reviewing 10% (around 1,000 rows) I would get enough insight."
I figured that, by reviewing 10% (around 1,000 rows) I would get enough insight."
Lukas
our experiment candidate
How Lukas Approached this Option
| Steps | |
| 1. Opened the file | Lukas started with a spreadsheet of 9480 airline reviews and began reading them, line by line. |
| 2. Started tagging manually | Lukas then created themes on the fly, tagging each comment with categories based on repeated topics. |
| 3. Struggled with overlap | Many reviews mentioned multiple themes, which made consistent tagging a challenge. |
| 4. Measured his pace | After 20 minutes, only 15 rows were reviewed. At 1 hour: 50. |
| 5. Realized the scale | At that rate, the full dataset would take 150+ hours. |
| 6. Quit the method |
Lukas stopped 1 hour in — it was too slow, too error-prone, and unsustainable. |
The takeaway here was that sampling can be a smart shortcut — if you know what to sample and how to weigh it. But Lukas found that, without structure, the sampling itself became another problem to solve. And even with a well-designed sample, tagging almost 1000 rows by hand would still eat up two days minimum.
This approach gives you full control, yes — but it comes at a cost. It’s slow, repetitive, and prone to human error. And the more complex the feedback is, the less confident you become in your coding decisions.
Option 1: Manual Analysis is Good When ✅
You’re working with fewer than 500 responses and want to stay close to customer language
You don’t need to scale or repeat the analysis regularly
You value depth over speed, and have the time to code responses manually
Option 1: Experiment Outcome 💡
Time spent: 1 hour
Progress: 40–50 rows meaningfully tagged
Projected time for full dataset: 150+ hours
Confidence in labels: Low — especially on multi-topic or mixed-sentiment responses
Final verdict: Quit one hour in. Not scalable. Too error-prone to trust.
Lukas walked away from this round convinced of one thing: Even with clean data, manual analysis isn’t just inefficient. It puts insight at risk.
Option 2: AI-Assisted Analysis (ChatGPT + R)
Lukas turned to AI next. First with ChatGPT alone, then with a more structured approach combining GPT guidance and R — hoping to speed things up and avoid the grind of manual tagging. The AI-assisted approach leveraged sentiment analysis and AI & Text Analytics to categorize open-ended survey responses and detect topics.
At first, things looked promising. ChatGPT alone could handle the full dataset and return results for every row. But those results weren’t great. When reviewing the data a little closer, sentiment was often wrong. Labels were inconsistent. And the model defaulted to “Mixed” far too often — even on clearly negative reviews.
With that in mind, Lukas quickly pivoted, using ChatGPT to instead help build an analysis workflow for R. This approach moved a lot faster than the manual work, but it came with risk. GPT was confident, even when it was wrong. R was flexible, but fiddly. Even viewing the outputs in R was clunky. It wasn’t clear where to focus, or what was worth visualizing. And neither delivered insights Lukas could fully stand behind.
How Lukas Approached this Option
| Steps | |
| 1. Used ChatGPT for tagging | Lukas ran the full dataset through ChatGPT and received labels for each review as part of the coding process, which included sentiment analysis to categorize responses by emotional tone. |
| 2. Spotted major issues | Too many reviews were inaccurately labeled as “Mixed” sentiment, even when clearly not. |
| 3. Built a workflow in R | Lukas asked GPT for help creating an R script to analyze and visualize the data. |
| 4. Pasted and ran code | Without fully understanding the script, Lukas copied and executed it, producing basic outputs. |
| 5. Created a graph | After 1h 40min, Lukas had a sentiment chart but couldn’t fully trust the data behind it. |
| 6. Lacked confidence | Despite the speed, the results weren’t reliable enough for reporting or decision-making |
"ChatGPT gives you answers instantly — the problem is that it sounds confident even when it’s completely off. You end up second-guessing everything.”
ChatGPT gives you answers instantly — the problem is that it sounds confident even when it’s completely off. You end up second-guessing everything.”
Lukas
our experiment candidate
Option 2: Analysing with ChatGPT + R is Good When ✅
You’re experimenting with small datasets and looking for directional insight
You’re technically comfortable with LLMs and scripting environments like R or Python
You’re building a first-draft summary or exploring patterns — not presenting final insights
Option 2: Experiment Outcome 💡
Time spent: ~1h 40min
Progress: 1 graph, partial tagging, inconsistent output
Label quality: Low to moderate — many issues with overuse of “Mixed” and incorrect topic tagging
Confidence in insights: Low — needed verification before use
Final verdict: Technically impressive, but not reliable. Useful for prototyping, not for reporting or making crucial business decisions.
Lukas ended this part of the experiment with one clear takeaway: AI can definitely help — but without structure and oversight, it could just as easily lead you astray.
Option 3: Building Your Own Tool (Hypothetically)
Let’s be clear: Lukas did not build a custom tool. Lukas is really great — but definitely doesn’t have the joint power of an entire IT department. Still, for the sake of comparison, we mapped out what it would take if you decided to go down the DIY route.
At first glance, building your own feedback analysis system sounds great. You get complete control: over features, interface, security, and the entire data pipeline. However, your tool would also need to support a robust coding process and enable thematic analysis to systematically organize and interpret open-ended survey responses. But people often forget that it’s a complex, long-term commitment that goes far beyond a one-time build.
How Lukas (Would Have) Approached this Option
| Steps | |
| 1. Considered the full build | Instead of actually building one, Lukas mapped out what a team would need to create a custom solution, including a systematic coding process and support for thematic analysis to identify pattern in open-ended survey responses. |
| 2. Outlined the resources | You’d need A/ML engineers, DevOps support, and product ownership. |
| 3. Estimated the timeline | A realistic build would take 12–24 months from scoping to production. |
| 4. Flagged the maintenance | Model updates, security checks, internal reviews — all ongoing commitments. |
| 5. Acknowledged the appeal | Total control over data, integrations, and logic sounds great — on paper. |
| 6. Deemed it impractical | Unless feedback analysis is core to your product, it’s hard to justify the cost or effort. |
The bottom line here is that you gain a lot of control — but at a pretty high price.
"It’s tempting to say ‘we could build this ourselves.’ But once you map out the time, cost, and approvals, you realize — just because you can, doesn’t mean you should.”
It’s tempting to say ‘we could build this ourselves.’ But once you map out the time, cost, and approvals, you realize — just because you can, doesn’t mean you should.”
Lukas
our experiment candidate
Option 3: Building your own tool is Good When ✅
You have specific, repeatable needs that off-the-shelf tools can’t handle
You’ve got an internal team with AI/ML and DevOps expertise, and the budget to support them
You want full control over data, taxonomy, integrations, and compliance — and can handle the long-term overhead
Option 3: Experiment Outcome 💡
Time to deploy: 12–24 months
Effort required: High — multiple teams, long-term commitment
Customizability: Total, but expensive
Total cost of ownership: Often underestimated
Final verdict: Only worth it if feedback analysis is central to your business IP
For most companies, the upfront investment is steep, the opportunity cost is real, and maintenance quickly becomes its own burden. For feedback analysis — where speed, flexibility, and reliability matter — the build route rarely wins on efficiency.
And for most teams, building in-house can be both slower and riskier. It can delay insight, add overhead, and pull valuable resources away from other priorities. That’s really why we built Caplena in the first place: to offer the control and power of a custom tool, without the wait or the complexity.
Option 4: AI-powered SaaS (Like Caplena)
After testing manual tagging, experimenting with generative AI, and fantasizing about being an entire department, Lukas moved on to Caplena — a dedicated platform for analyzing open-ended survey responses. With nothing but a 30-minute intro call under the belt, Lukas took the dataset and handled the entire process solo.
Despite being new to the tool, getting started was easy. Uploading the data was smooth (even after a small error, quickly fixed with a re-upload). Column selection and data type definition were intuitive, and in just a few clicks, Lukas had auto-generated topics ready to review.
How Lukas Approached this Option
| Steps | |
| 1. Joined a short onboarding | With just a 30-minute intro call, Lukas felt ready to use the platform independently. |
| 2. Uploaded and selected columns | Lukas uploaded the dataset, picked the relevant fields, and launched topic detection. |
| 3. Reviewed and refined topics | Caplena's automated coding process categorized open-ended survey responses, which Lukas refined over roughly 40 minutes to improve its accuracy. |
| 4. Watched the AI improve | As Lukas trained the model, the quality of pre-selected topics noticeably got better, supporting a robust thematic analysis by grouping responses into meaningful themes. |
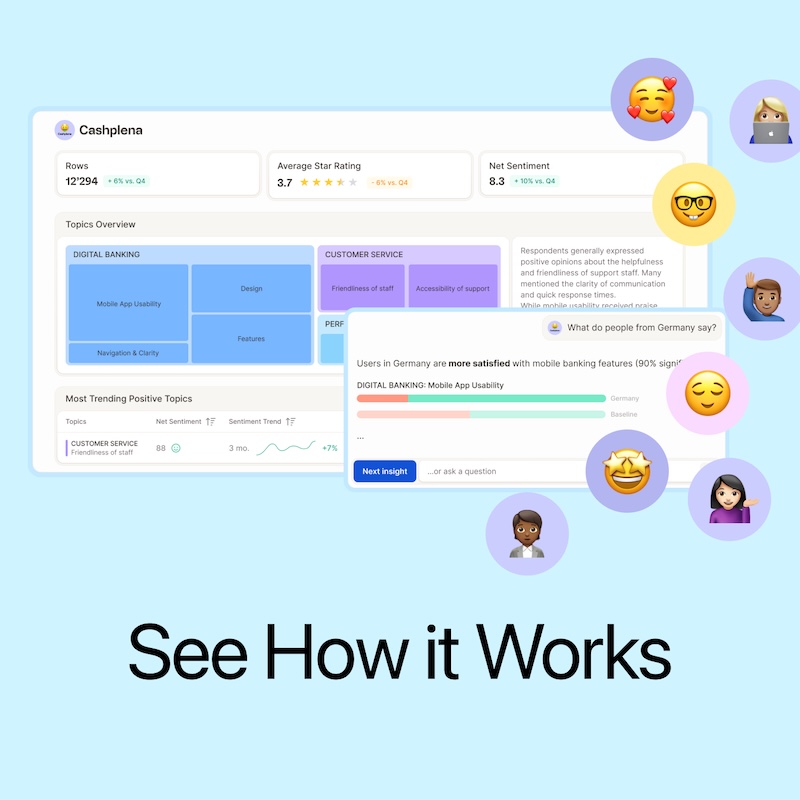
| 5. Explored the dashboard | Lukas filtered by airline, clicked into themes, and reviewed examples without exporting anything. |
| 6. Used InsightChat | Lukas asked the Caplena AI questions like “What are the top issues for Airline A?” — and got instant, accurate summaries. |
Caplena stood out for its speed, structure, and usability. Setup took just minutes, with topics generated in seconds and only minor delays during processing. While the AI pre-tagged responses automatically through its coding processes, Lukas spent around 40 minutes refining labels — an investment that paid off as the model improved with each batch and enabled effective thematic analysis.
"It felt like the first time I wasn’t just analyzing data — I was actually learning from it.”
It felt like the first time I wasn’t just analyzing data — I was actually learning from it.”
Lukas
our experiment candidate
Unlike GPT or R, the results were consistently accurate and easy to explore through an interactive dashboard. By clicking into the data, anyone could see the original comments behind any trend or pattern. The AI's automatic summaries and recommendations made complex insights easy to understand and act on.
And with “Insight Agent,” Lukas could ask the tool questions and receive clear, trustworthy summaries without any extra scripting. These summaries combine quantitative metrics with qualitative insights, focusing on statistically significant patterns and trends that emerge from the data. The AI surfaces key findings that can be traced back to the source responses.
Option 4: an AI-powered SaaS tool is Good When ✅
You need to process large volumes of text data accurately and efficiently
You want a solution that balances automation with human-in-the-loop reviews and refinement
You’re working across languages, teams, or markets — and need insights that scale without sacrificing clarity
Option 4: Experiment Outcome 💡
Time spent: ~1h 15 min total, including manual review
Progress: Full dataset processed, topics refined, dashboards live
Label quality: High — with clear improvement over time
Confidence in insights: High — due to traceable logic and manual validation
Final verdict: Intuitive, fast, and reliable. A major step up in both speed and insight quality.
Compared to previous methods, Caplena didn’t just save time — it gave Lukas confidence. The analysis felt trustworthy, the outputs were stakeholder-ready, and most importantly, Lukas could focus on using the insights, not just digging for them.
Summary of the Live Experiment
Lukas tried all four approaches — from full manual tagging to AI-powered SaaS — and the differences were pretty clear. While each method has its place, only one delivered speed, structure, and results that Lukas felt confident sharing: Caplena.
Caplena is also the obvious choice for many of our clients, thanks to its efficiency and accuracy in handling open-ended feedback. That said, combining different approaches (like manual coding with AI analysis) can add value, as demonstrated by the market research agency Factworks. They chose to manually code answers in parallel with the Caplena software to fully understand the AI's behavior, identify strengths and weaknesses, and fine-tune the setup as needed.
Visualization tools like word clouds can help present the results of open-ended survey analysis in an accessible way, making it easier to interpret and communicate key themes alongside quantitative data.
To wrap things up, we asked Lukas to reflect on the process.
Which method gave the best balance of speed and insight?
“Caplena. It offered quick setup, accurate labeling, and easy-to-share outputs — all without compromising control or clarity.”
Which gave the most confidence in the results?
“Probably also Caplena. The traceability of labels, the ability to review and refine, and the transparency of the AI made it easy to trust what the data was saying.”
What was the most frustrating part of the whole experiment?
“Trying to clean and tag everything manually — or watching GPT confidently deliver wrong answers without realizing it. Both were exhausting in different ways.”
What would you tell someone else to avoid?
“Don’t rely on automation alone. And don’t try to do everything by hand unless you have weeks to spare. Accuracy requires structure — and structure takes more than a spreadsheet.”
How the 4 Options Compare
| Method | Setup Time | Effort Level | Best For | Main Risk | Confidence in Output |
| Manual Analysis | Low | Very High | Small datasets, close-reading needs, detailed coding process and thematic analysis | Fatigue, inconsistency, very slow | Low |
| GPT + R (AI) | Medium | Medium | Prototyping or exploring small datasets, initial thematic analysis | Inaccurate labels, overconfident | Moderate |
| Build Your Own Tool | Very High | Very High | Fully custom workflows and in-house AI capabilities, advanced coding process | High cost, long delays, maintenance burden | High |
| Caplena | Low | Low | Fast, reliable insights at scale, systematic coding process and thematic analysis for meaningful conclusions | Some upfront labeling effort | High |
If you're serious about turning open-ended feedback into insights you can actually use — and share — here’s what Lukas' experience makes clear.
Don’t go fully manual
Unless you’re working with a tiny dataset, tagging comments by hand will cost you time, consistency, and confidence. Even though manual analysis allows for a detailed coding process and thematic analysis, sampling might help — but even that comes with its own overhead.Don’t blindly trust generative AI
LLMs like ChatGPT can be helpful for early exploration and initial thematic analysis, but they’re not built for structured, large-scale feedback analysis. Their output sounds good — until it doesn’t.Avoid building unless it’s your core product
Yes, you could build your own tool. But unless your team has the bandwidth, budget, and long-term commitment to maintain it, it’s more likely to delay insights than deliver them, even if it enables a custom coding process.Evaluate a purpose-built tool for your data
Caplena was built specifically for analyzing open-ended feedback at scale. It’s fast to set up, easy to refine, and powerful enough to share insights your stakeholders can trust. By leveraging a systematic coding process and thematic analysis, Caplena helps you derive meaningful conclusions from your open-ended survey responses.
When done right, qualitative analysis can support your research and drive it forward. It gives you the “why” behind the metrics, the nuance behind the scores, and the clarity your stakeholders are looking for. Caplena is built for that — helping you go from raw feedback to actionable insight, faster and smarter.
If you’re curious about Caplena, feel free to book a call. We’d be happy to show you around.
Related blog posts


Everything You Need to Know About The Job Market After Covid 🦠
In the last two years, our work practices have undergone some significant changes. At the present time, there appears to be an increase in the number of job switches. This article examines the reasons for this by analyzing various studies – as well as our own in-house survey.
6 Things That Make Christmas Markets so Irresistibly Christmassy
What are the most common things people mention when they talk about their most recent Christmas market visit? To find out, we studied three highly rated – but different – Christmas markets to analyze their Google reviews.

Customer Review Champion: Adidas vs Nike
Who is the GOAT, Messi or Ronaldo? Are you a Derrick Rose or LeBron James fan? Do you prefer Collin Morikawa or Rory McIlroy? Depending on your answers, it is likely we could predict your favorite footwear brand. How?

How to Collect Surveys and Conduct Feedback Analysis in 1 Day
The research world is like a toolbox. Within the toolbox are surveys, focus groups, and experiments. Recently, the size of this toolbox has increased with social media, internet-based surveys, and mobile phones being used more frequently...
Five Guys’ Marketing Strategy: A Customer Review Analysis
Five Guys caters to burger lovers seeking high-quality food and friendly service – all while keeping things simple. To understand how Five Guys operates its successful marketing strategy, we analyzed 1,236 Google Maps reviews using the text analysis tool, Caplena.
Analyzing Netflix Open-Ended Feedback: A 3½-Step Video Tutorial
This tutorial is all about Netflix! : We’ll take you through every step required to evaluate your open texts with the help of AI. If you follow the 3 required steps described in the guide below in all detail, it will take you approximately 45 minutes to get to achieve these results.
Everything You Need to Know About The Job Market After Covid 🦠
In the last two years, our work practices have undergone some significant changes. At the present time, there appears to be an increase in the number of job switches. This article examines the reasons for this by analyzing various studies – as well as our own in-house survey.
6 Things That Make Christmas Markets so Irresistibly Christmassy
What are the most common things people mention when they talk about their most recent Christmas market visit? To find out, we studied three highly rated – but different – Christmas markets to analyze their Google reviews.
Customer Review Champion: Adidas vs Nike
Who is the GOAT, Messi or Ronaldo? Are you a Derrick Rose or LeBron James fan? Do you prefer Collin Morikawa or Rory McIlroy? Depending on your answers, it is likely we could predict your favorite footwear brand. How?
How to Collect Surveys and Conduct Feedback Analysis in 1 Day
The research world is like a toolbox. Within the toolbox are surveys, focus groups, and experiments. Recently, the size of this toolbox has increased with social media, internet-based surveys, and mobile phones being used more frequently...
Five Guys’ Marketing Strategy: A Customer Review Analysis
Five Guys caters to burger lovers seeking high-quality food and friendly service – all while keeping things simple. To understand how Five Guys operates its successful marketing strategy, we analyzed 1,236 Google Maps reviews using the text analysis tool, Caplena.
Analyzing Netflix Open-Ended Feedback: A 3½-Step Video Tutorial
This tutorial is all about Netflix! : We’ll take you through every step required to evaluate your open texts with the help of AI. If you follow the 3 required steps described in the guide below in all detail, it will take you approximately 45 minutes to get to achieve these results.