Chart of the Month: Relationship Chart 🧑🤝🧑
Sheila Bugal
Caplena offers many visualization options, for example, the driver chart or the treemap. This blog post is all about the Relationship Chart – although it’s not too good at sticking to just one relationship at a time . Staying in line with its polyamorous spirit, the relationship chart’s tendency to find relationships wherever it looks is actually a very good thing, as it helps us determine which correlations are important, which aren’t, which are strong – or fragile, so that we can design an effective strategy based on these facts, no matter what our agenda is.
Relationship Chart Structure
Models of data are represented by nodes and links, and the strength of a connection between two nodes depends on their interrelationship. Consider the following diagram . ‘Bob’ is a node. Bob is interested in the Mona Lisa painting, which is located in the Louvre, which, in turn, is a museum.
Source: www.allthingsdistributed.com
Graphs of relationships can be quite simple, such as the one above. In Caplena’s relationship chart, the concept is the same, but instead of individual people, places, or things, Caplena groups responses to surveys or other types of text comments into bulk categories known as codes.
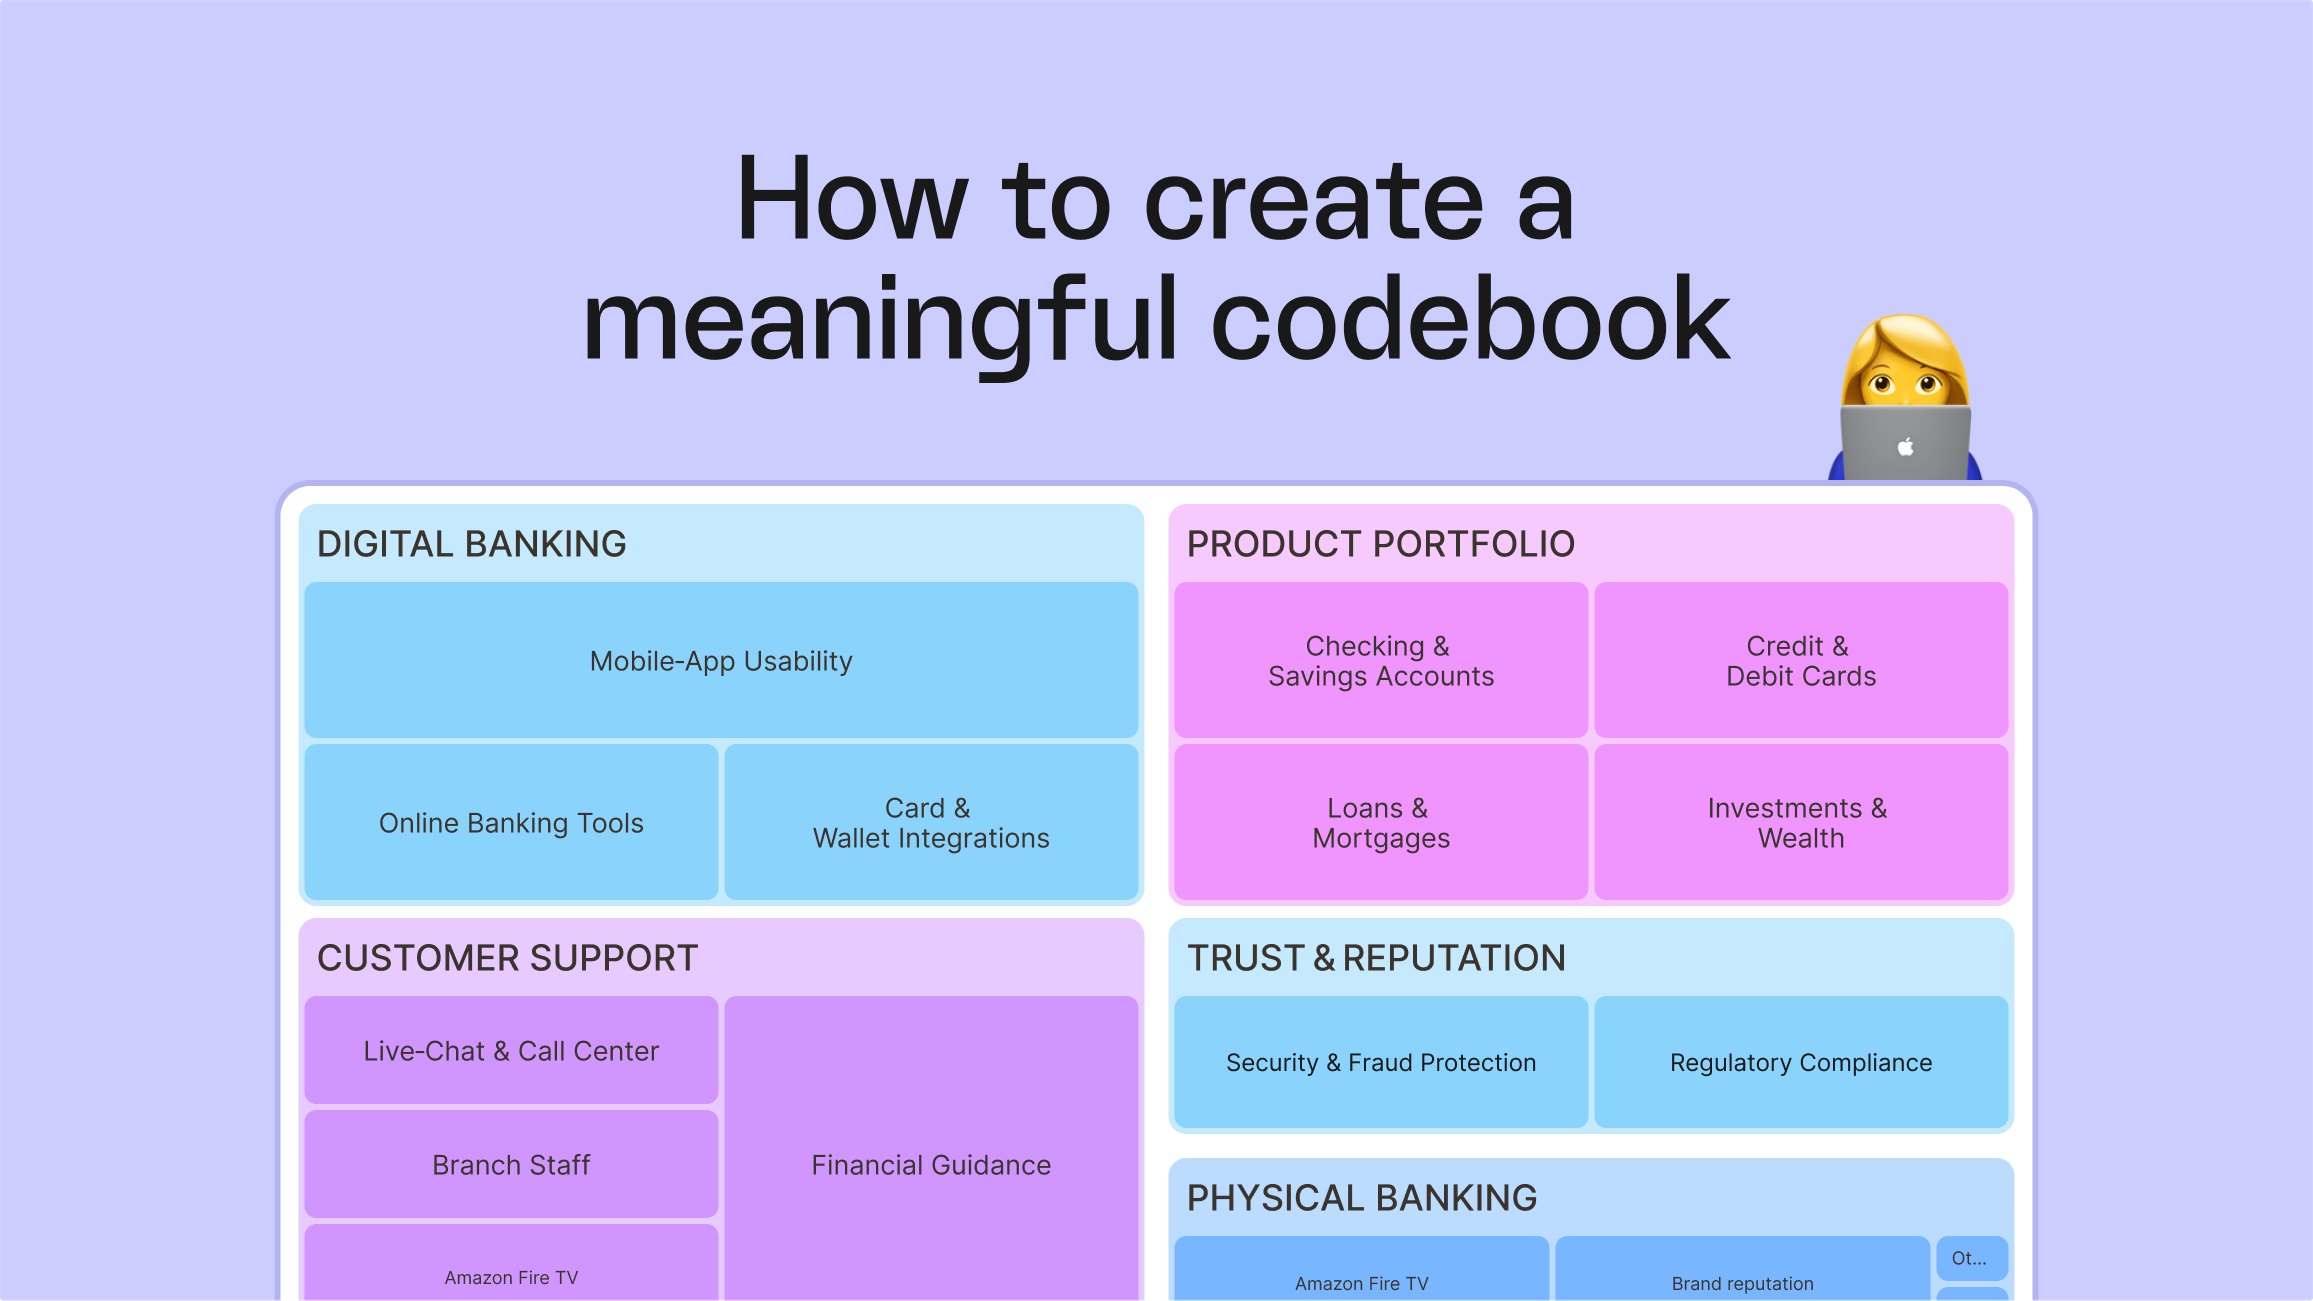
What’s a code?
Let’s say that instead of one sheet of paper with Bob’s name on it, the node of Bob is a stack of 200 sheets, full of people interested in the Mona Lisa painting. It’s the same principle, but since there is now a stack of people that were categorized as having the same interests as Bob. This is known as a code on the Caplena platform.
Applications
Understanding how topics relate to each other can come in handy in a variety of ways. Advanced disease research can employ relationship charts to display links between diseases and gene interactions. By examining these links, you can identify patterns in protein pathways that may contribute to a particular disease. Mind-boggling stuff, isn’t it? A sufficient amount of relationship data will even help you predict the future!
Check out the video below to see how a typical relationship chart would look in Caplena.
Relationship Chart in Caplena
Let’s go through one more example of Caplena usability using an NPS survey on mobile carriers. When you hover over what makes the Unlimited Data code, it shows a correlation with being Cheap/Affordable. This means that when people talk about how cheap and affordable the service is, they often also mention that they have unlimited data.
To stay on theme with the NPS survey of mobile carriers above, imagine yourself as the head of the mobile carrier and how helpful these relationships could be to understand what you need to do to improve and where you should invest your resources. You could invest your time & money in a smarter way if you realize that (for example) unhappy customers are often caused by rude customer service – rather than what you first thought was the issue – connectivity.
Related blog posts


Everything You Need to Know About The Job Market After Covid 🦠
In the last two years, our work practices have undergone some significant changes. At the present time, there appears to be an increase in the number of job switches. This article examines the reasons for this by analyzing various studies – as well as our own in-house survey.
6 Things That Make Christmas Markets so Irresistibly Christmassy
What are the most common things people mention when they talk about their most recent Christmas market visit? To find out, we studied three highly rated – but different – Christmas markets to analyze their Google reviews.

Customer Review Champion: Adidas vs Nike
Who is the GOAT, Messi or Ronaldo? Are you a Derrick Rose or LeBron James fan? Do you prefer Collin Morikawa or Rory McIlroy? Depending on your answers, it is likely we could predict your favorite footwear brand. How?
How to Collect Surveys and Conduct Feedback Analysis in 1 Day
The research world is like a toolbox. Within the toolbox are surveys, focus groups, and experiments. Recently, the size of this toolbox has increased with social media, internet-based surveys, and mobile phones being used more frequently...
Five Guys’ Marketing Strategy: A Customer Review Analysis
Five Guys caters to burger lovers seeking high-quality food and friendly service – all while keeping things simple. To understand how Five Guys operates its successful marketing strategy, we analyzed 1,236 Google Maps reviews using the text analysis tool, Caplena.
Analyzing Netflix Open-Ended Feedback: A 3½-Step Video Tutorial
This tutorial is all about Netflix! : We’ll take you through every step required to evaluate your open texts with the help of AI. If you follow the 3 required steps described in the guide below in all detail, it will take you approximately 45 minutes to get to achieve these results.
Everything You Need to Know About The Job Market After Covid 🦠
In the last two years, our work practices have undergone some significant changes. At the present time, there appears to be an increase in the number of job switches. This article examines the reasons for this by analyzing various studies – as well as our own in-house survey.
6 Things That Make Christmas Markets so Irresistibly Christmassy
What are the most common things people mention when they talk about their most recent Christmas market visit? To find out, we studied three highly rated – but different – Christmas markets to analyze their Google reviews.
Customer Review Champion: Adidas vs Nike
Who is the GOAT, Messi or Ronaldo? Are you a Derrick Rose or LeBron James fan? Do you prefer Collin Morikawa or Rory McIlroy? Depending on your answers, it is likely we could predict your favorite footwear brand. How?
How to Collect Surveys and Conduct Feedback Analysis in 1 Day
The research world is like a toolbox. Within the toolbox are surveys, focus groups, and experiments. Recently, the size of this toolbox has increased with social media, internet-based surveys, and mobile phones being used more frequently...
Five Guys’ Marketing Strategy: A Customer Review Analysis
Five Guys caters to burger lovers seeking high-quality food and friendly service – all while keeping things simple. To understand how Five Guys operates its successful marketing strategy, we analyzed 1,236 Google Maps reviews using the text analysis tool, Caplena.
Analyzing Netflix Open-Ended Feedback: A 3½-Step Video Tutorial
This tutorial is all about Netflix! : We’ll take you through every step required to evaluate your open texts with the help of AI. If you follow the 3 required steps described in the guide below in all detail, it will take you approximately 45 minutes to get to achieve these results.