Analyzing Netflix Open-Ended Feedback: A 3½-Step Video Tutorial
Sheila Bugal
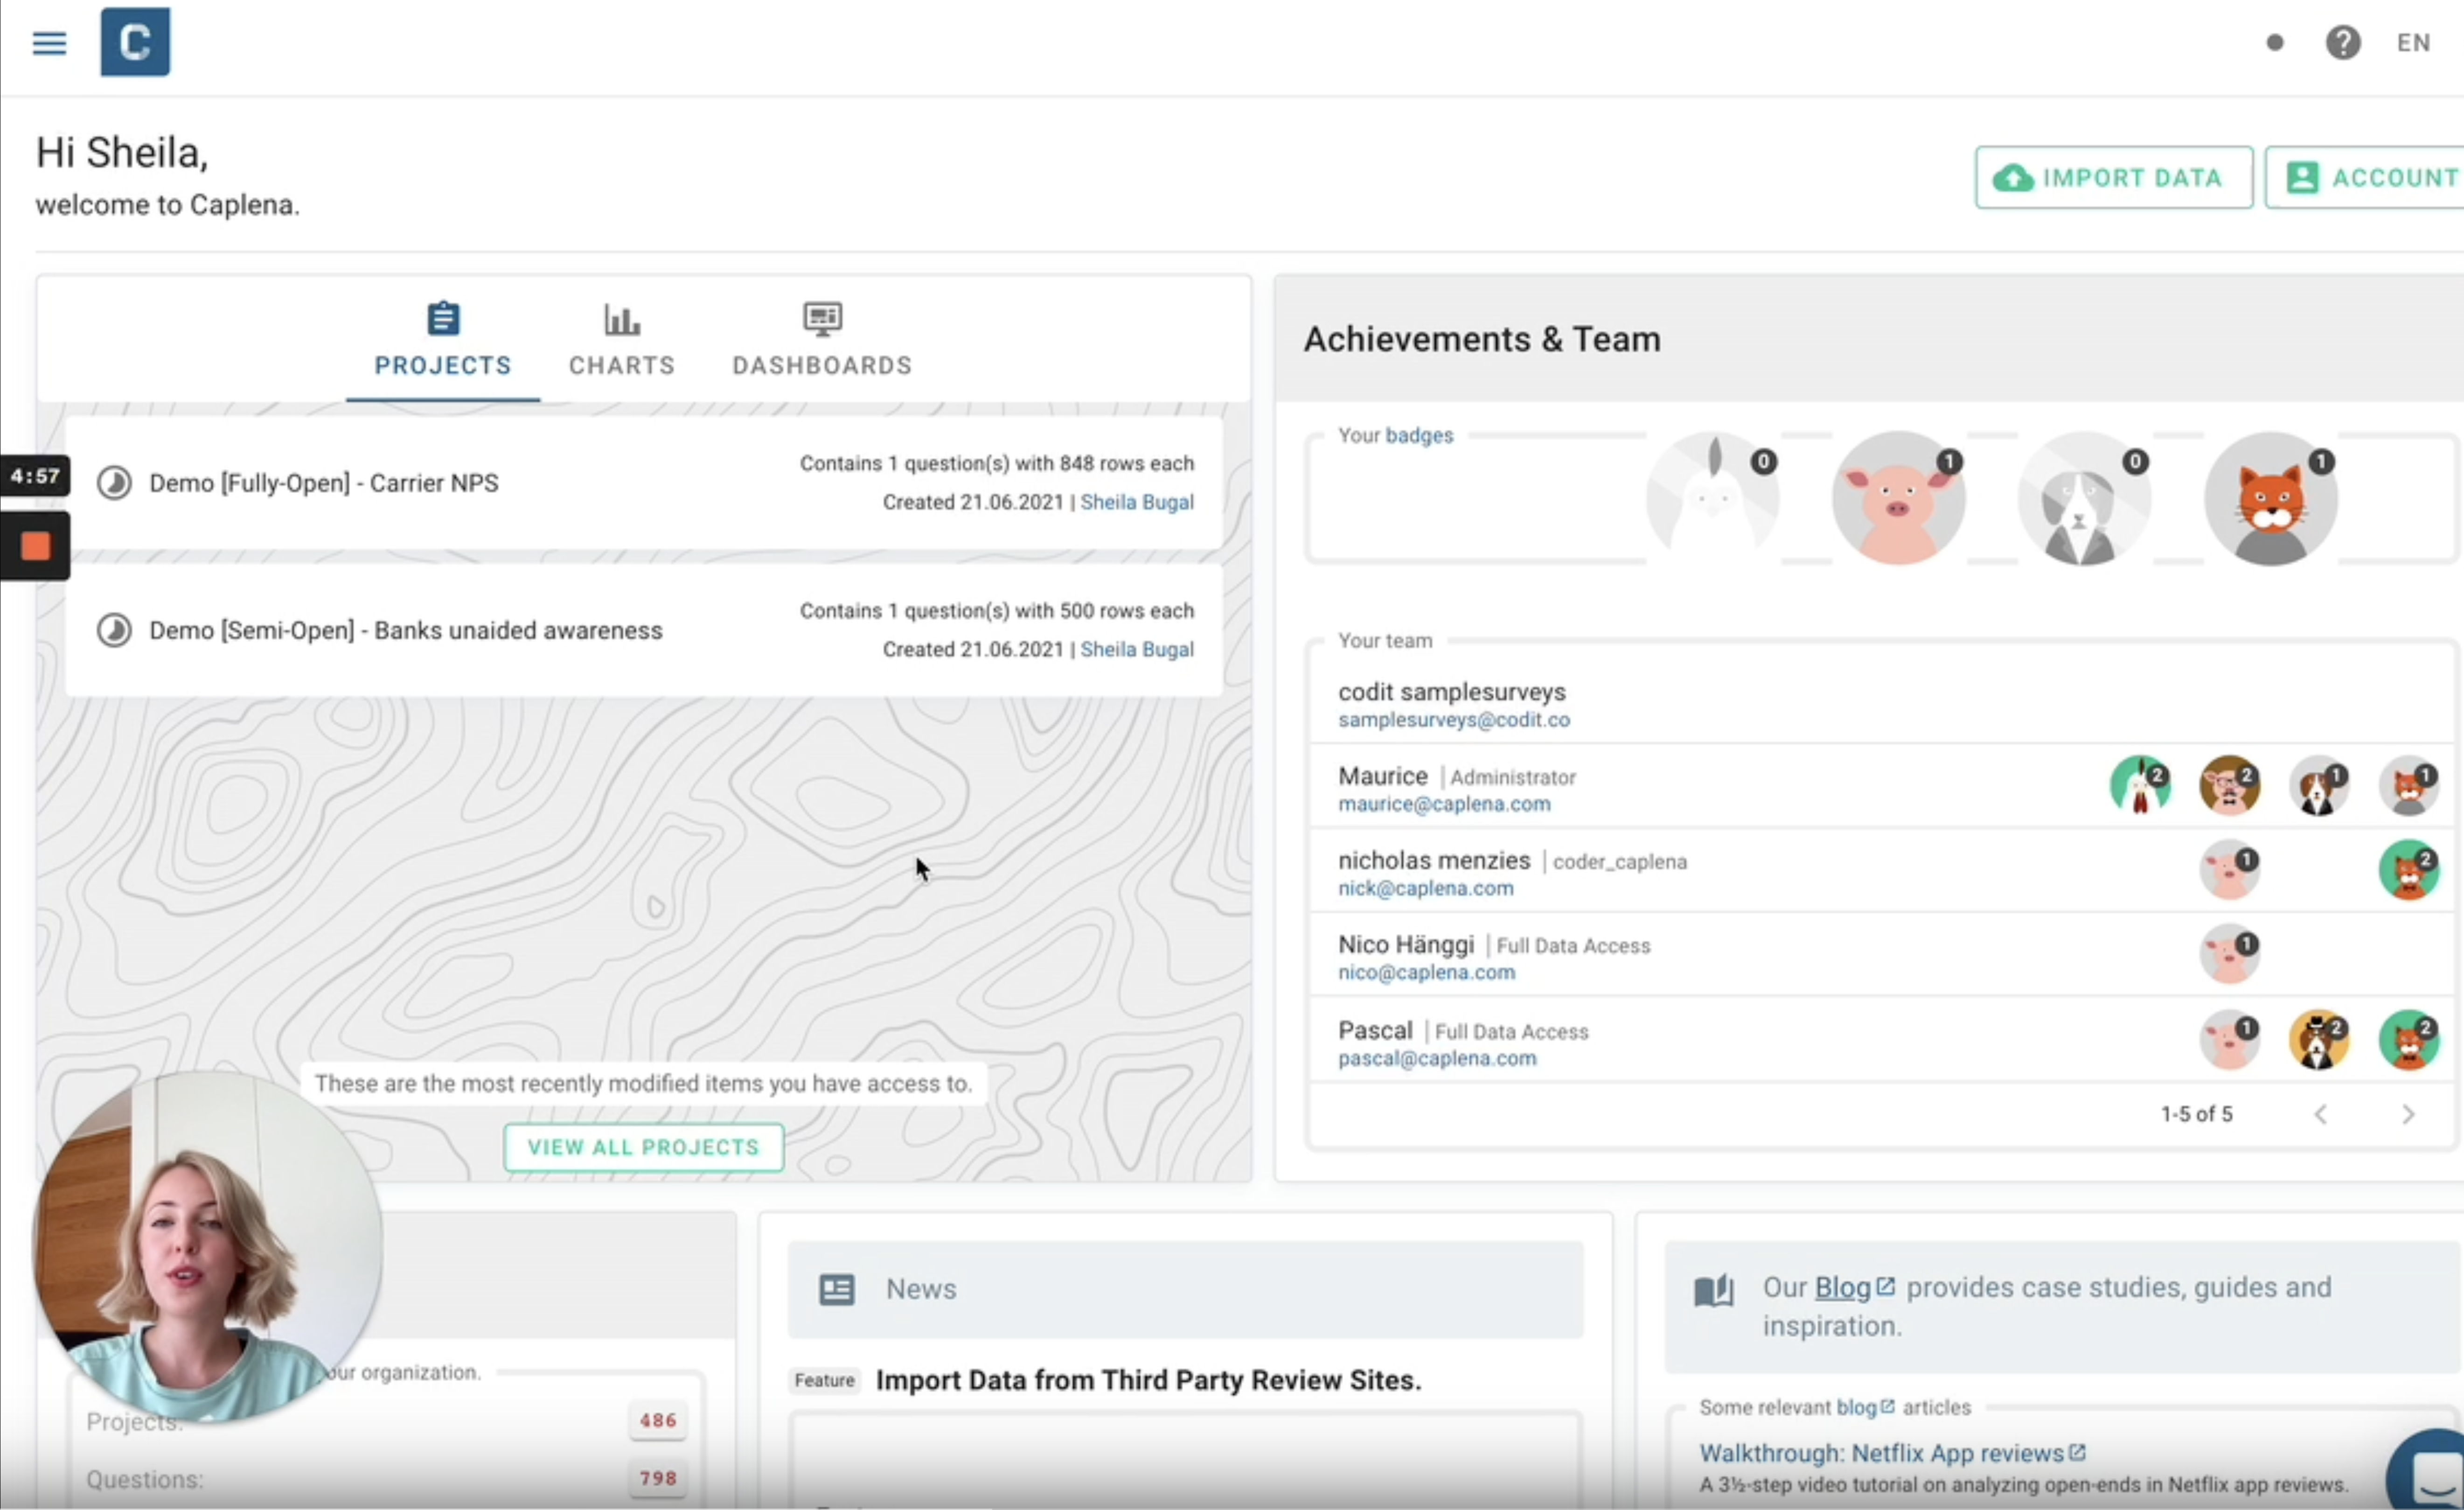
Video Walkthrough: Text Analysis of Netflix App Reviews
This tutorial is all about Netflix! : We’ll take you through every step required to evaluate your open texts with the help of AI. If you follow the 3 required steps described in the guide below in all detail, it will take you approximately 45 minutes to get to achieve these results.
What is the expected result?
The basic principle when having to evaluate free text is called coding: Coding is the process of assigning one or more codes (tags or topics) to every text element.
Example: Two codes are assigned to this piece of user feedback.
When you have assigned codes to a majority or even all of your text elements, you can create statistics, charts such as treemaps, and dashboards, describing your results:
Would you have guessed that the most requested feature on the Netflix App is video playback speed? Check out this example dashboard.
Now, these steps can of course be done manually in Excel or some other coding software. It even should be done there if you have, say, only 50 text elements. But if you have 200, this becomes unpractical – if you have 5000 borderline impossible.
That’s why the following guide helps you eliminate most of the tedious work associated with the analysis of open-ends. And enables you to spend more time & thought on the task which actually requires your problem apprehension and insights: Making sense of the results.
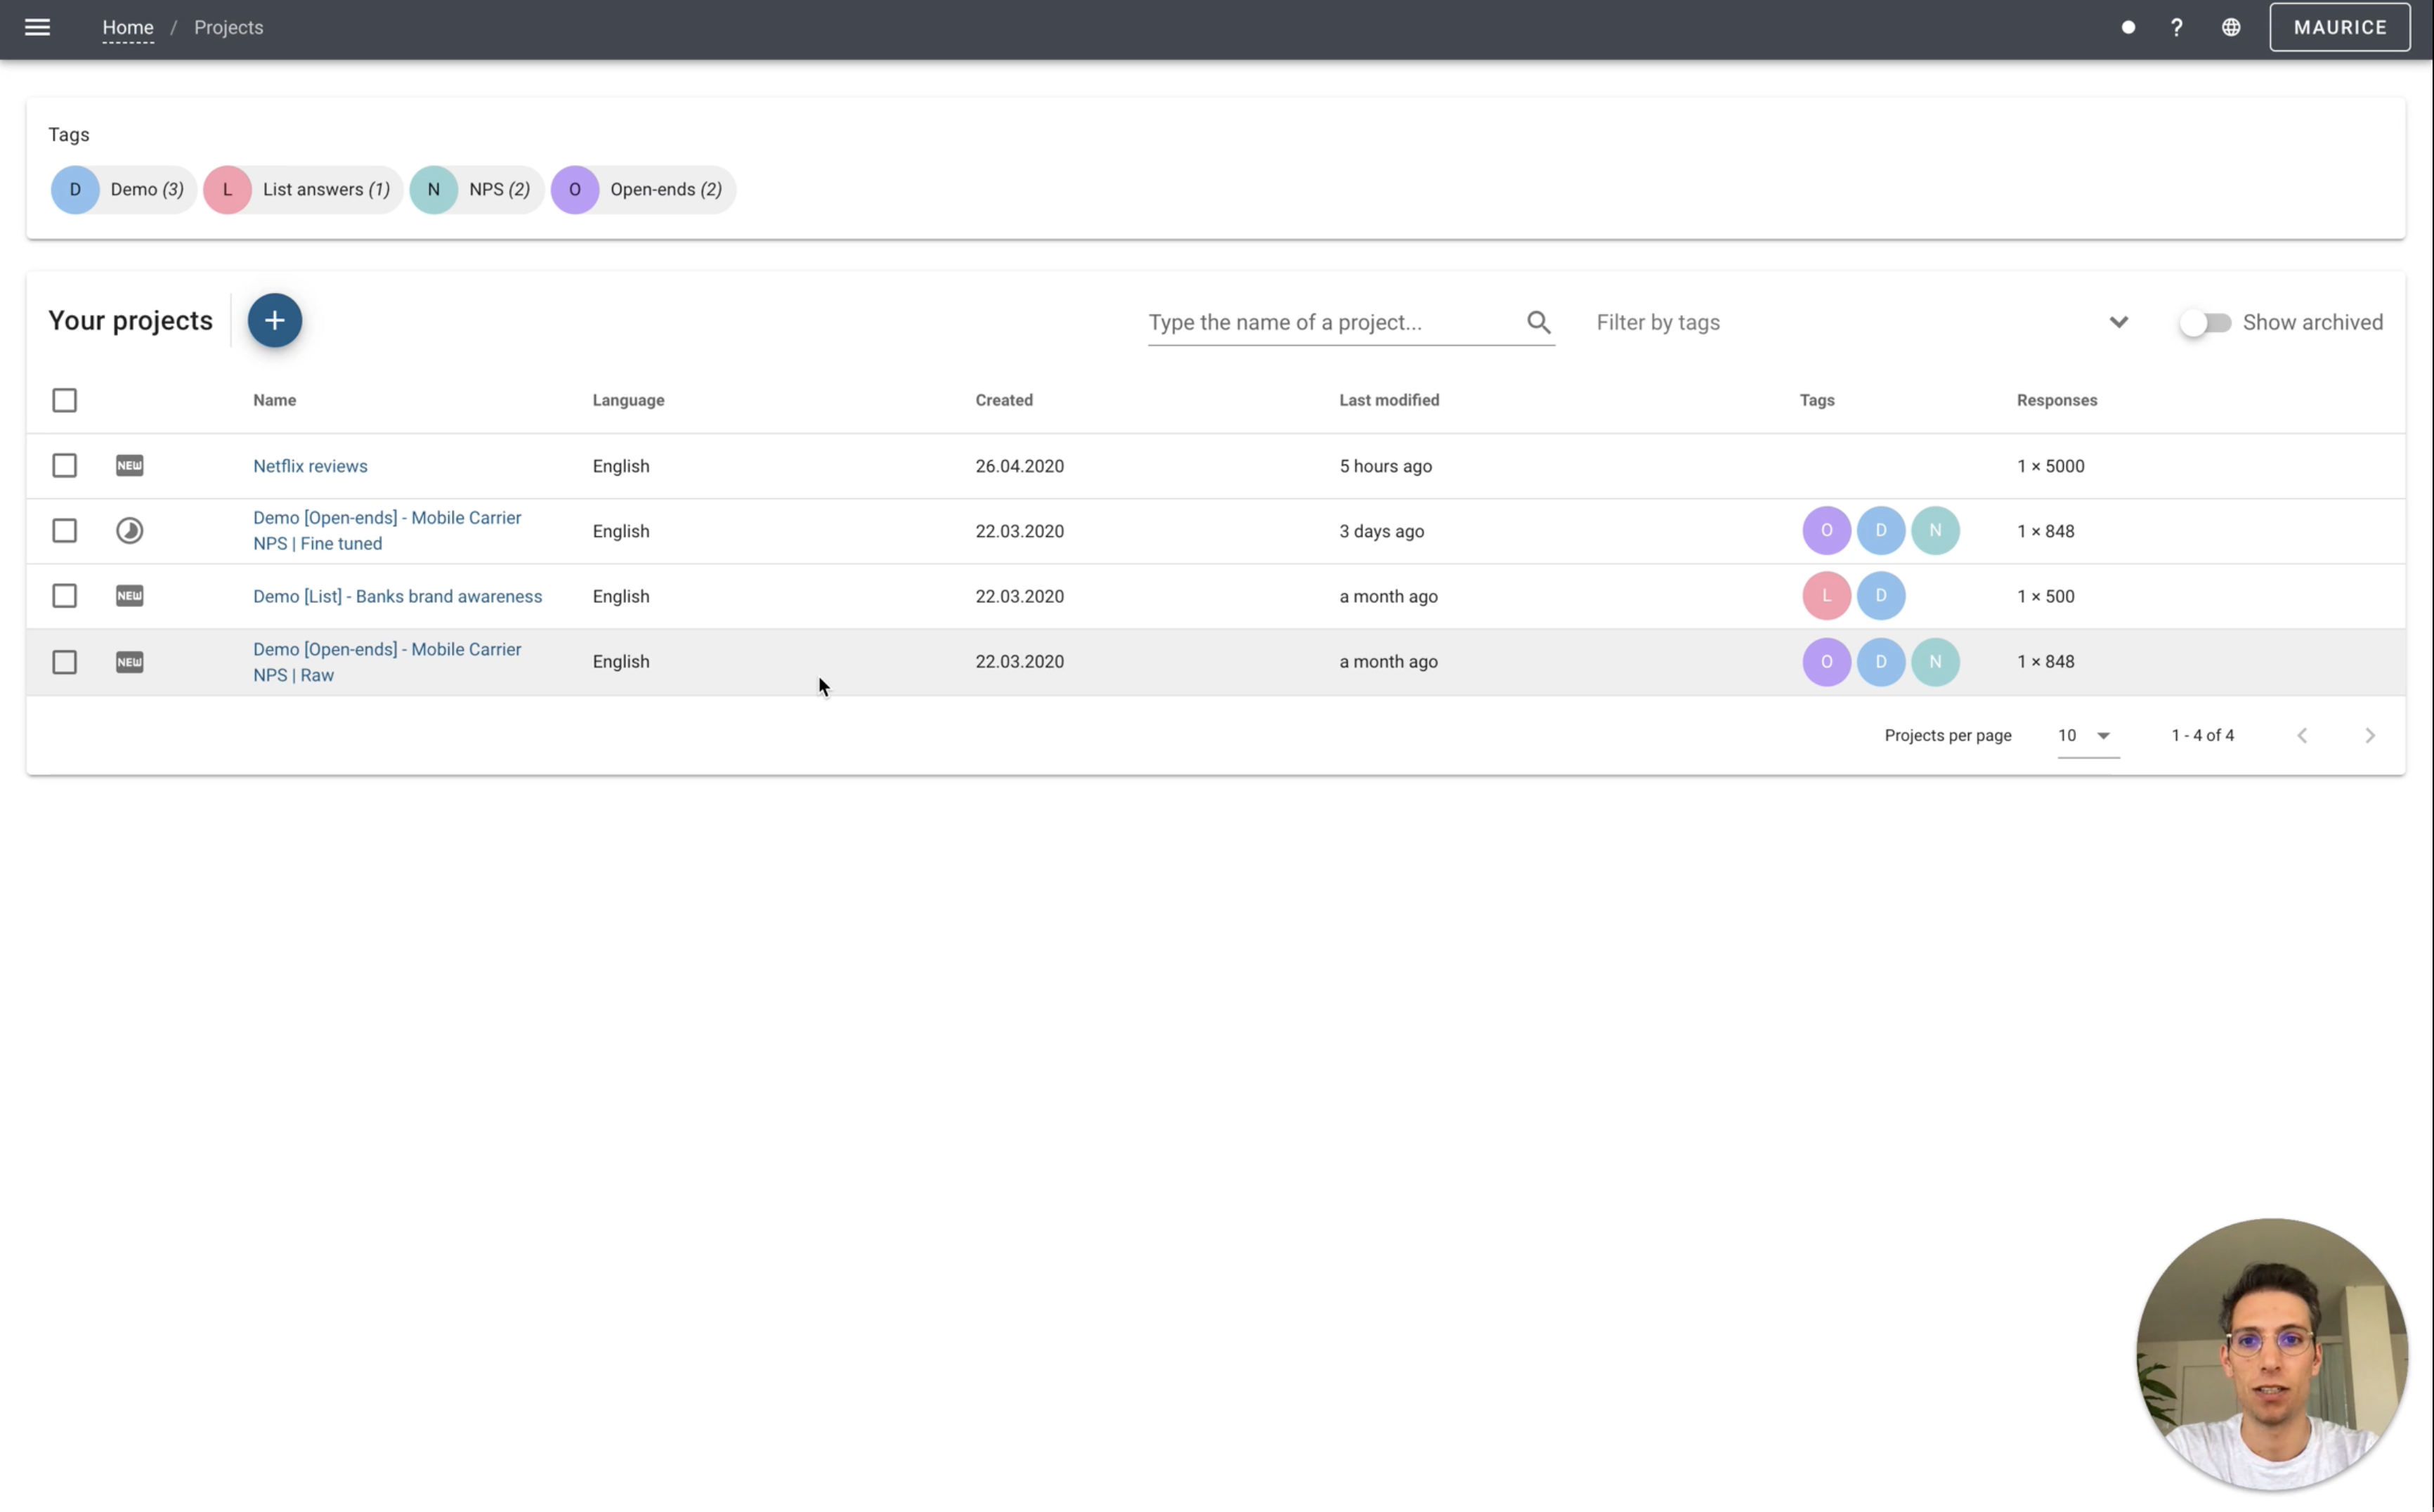
Step 1: Import Netflix Data
The first step is obviously getting your hands on the data. How this is accomplished depends on what you are working on: Ask your clients for feedback, send out an NPS survey or scrape the web for social media posts or product reviews.
In this tutorial, we will use 5,000 feedback responses about the Netflix app from the Google Playstore.
As you might have guessed, we’re going to use Caplena to evaluate the data. We might be slightly biased here, but we’re pretty sure this is the hottest text-analysis tool currently out there .
Caplena’s latest integration feature allows you to simply copy and paste the Google Playstore link – and you’re done!
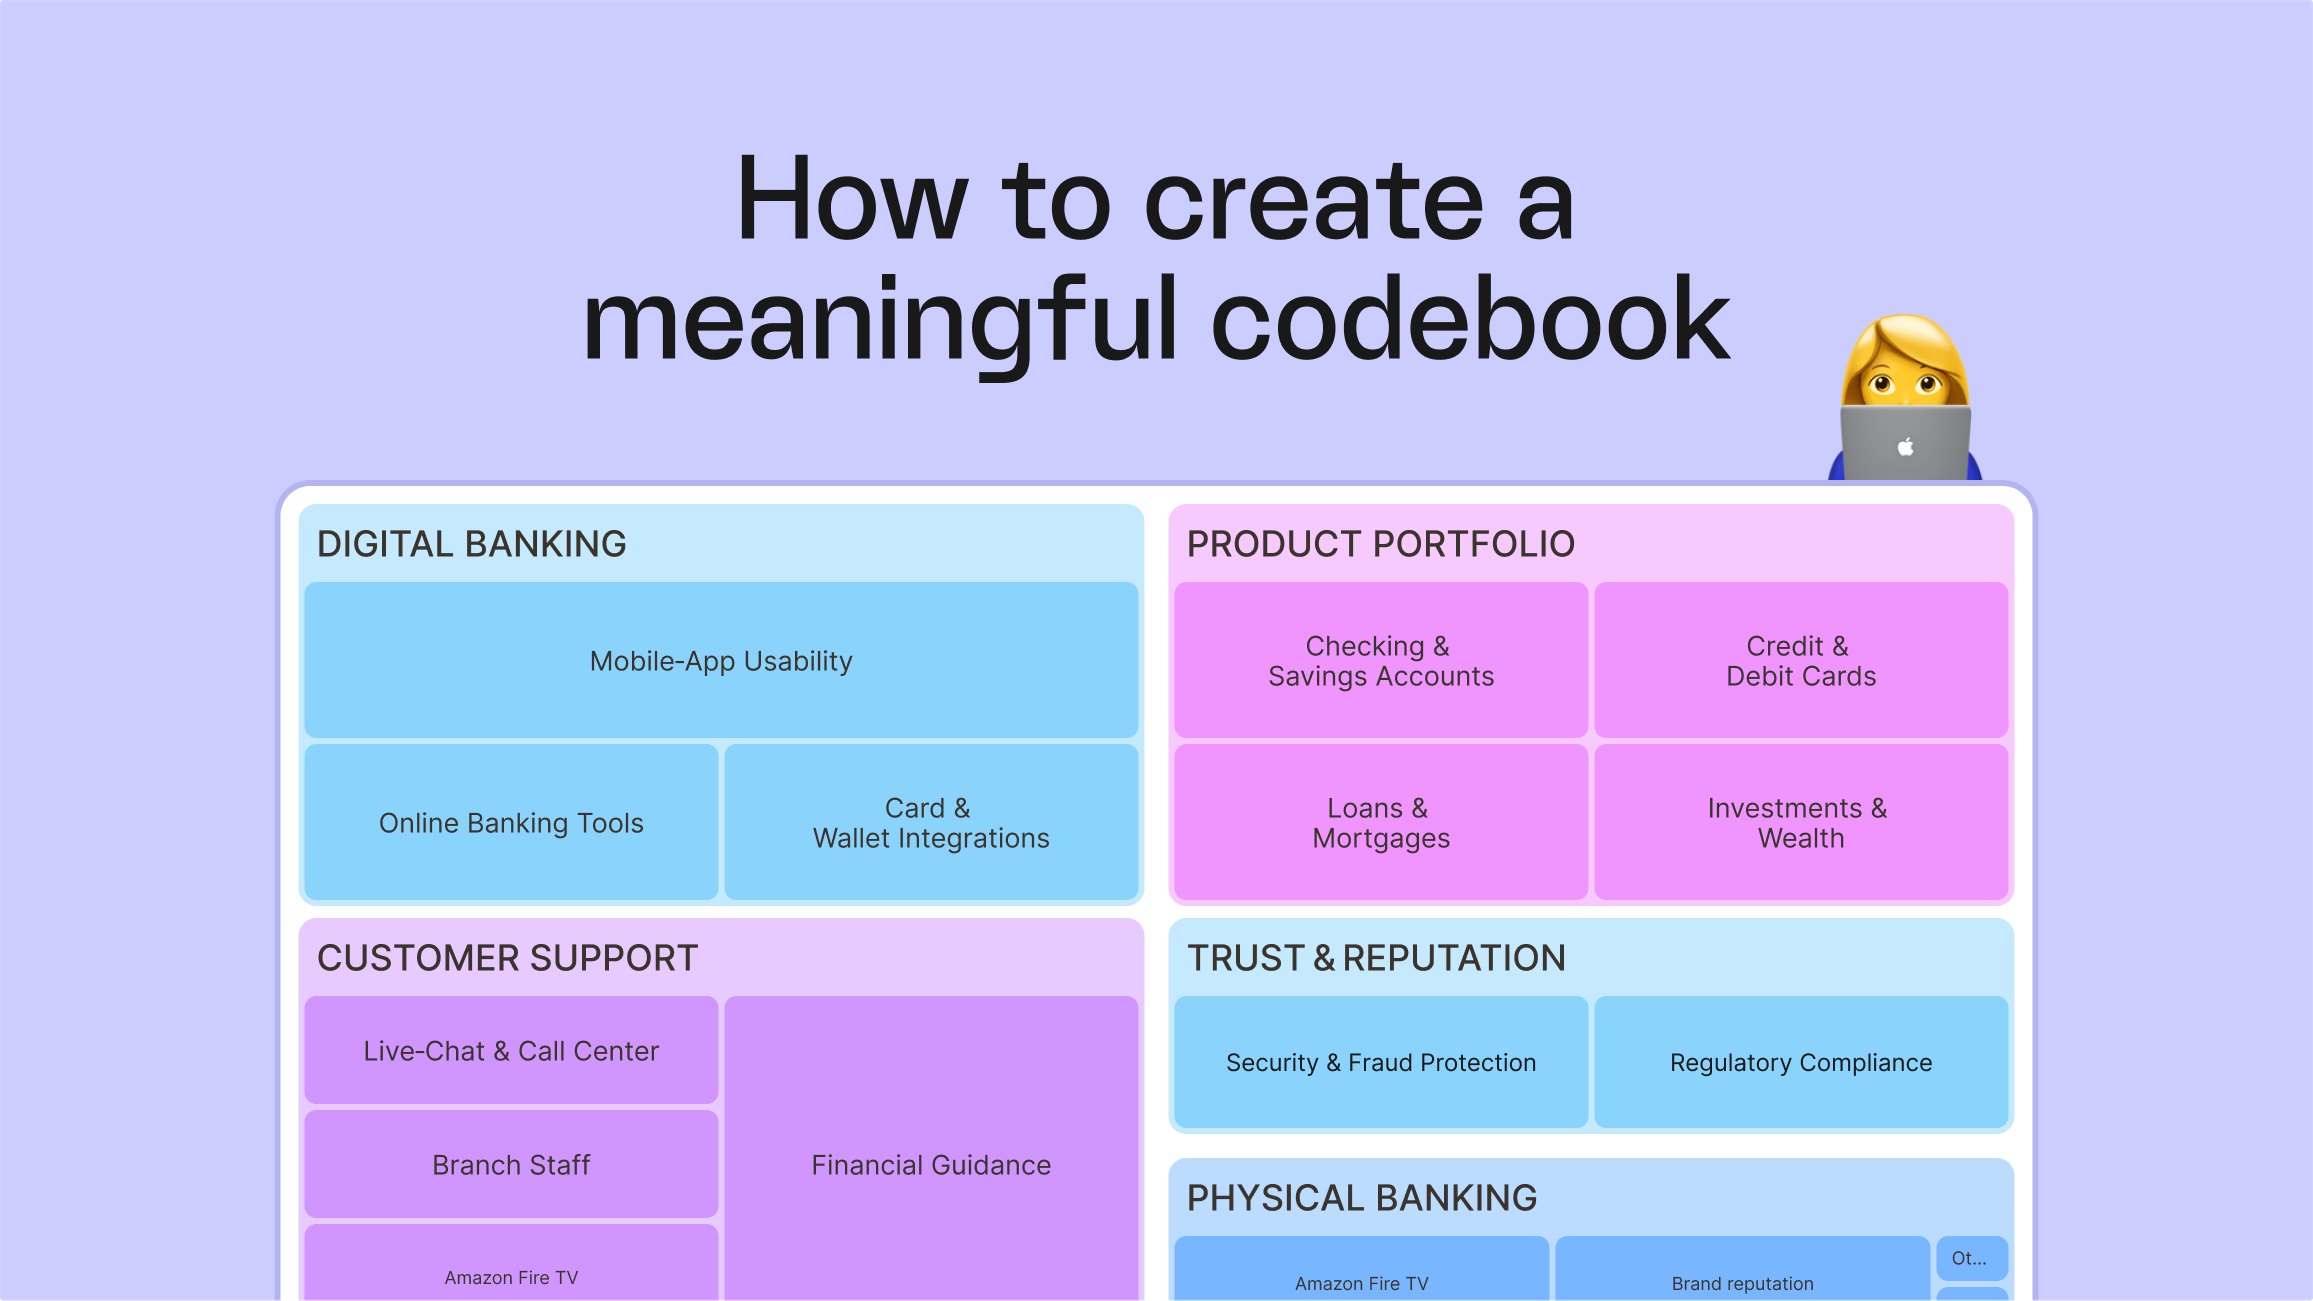
Step 2: Netflix Topic detection
The result of this step is a codebook, i.e. a list of codes (tags) that should be attached to the texts. Codes are topics, themes, or concepts that are higher level than keywords. Keywords, as other tools deliver them, might be Service or price. Codes on Caplena look like this:
Codes are high-level concepts and can include sentiment, either explicitly (example #1) or implicitly (example #3). See how “Service” can mean two different things in different codes – making them much more powerful than keywords.
The process on Caplena is a prime example of augmented intelligence: Our algorithm detects topics, but your industry knowledge and abstraction capabilities are required to improve organization & clustering.
Step 3: Fine-Tuning Netflix Reviews (optional)
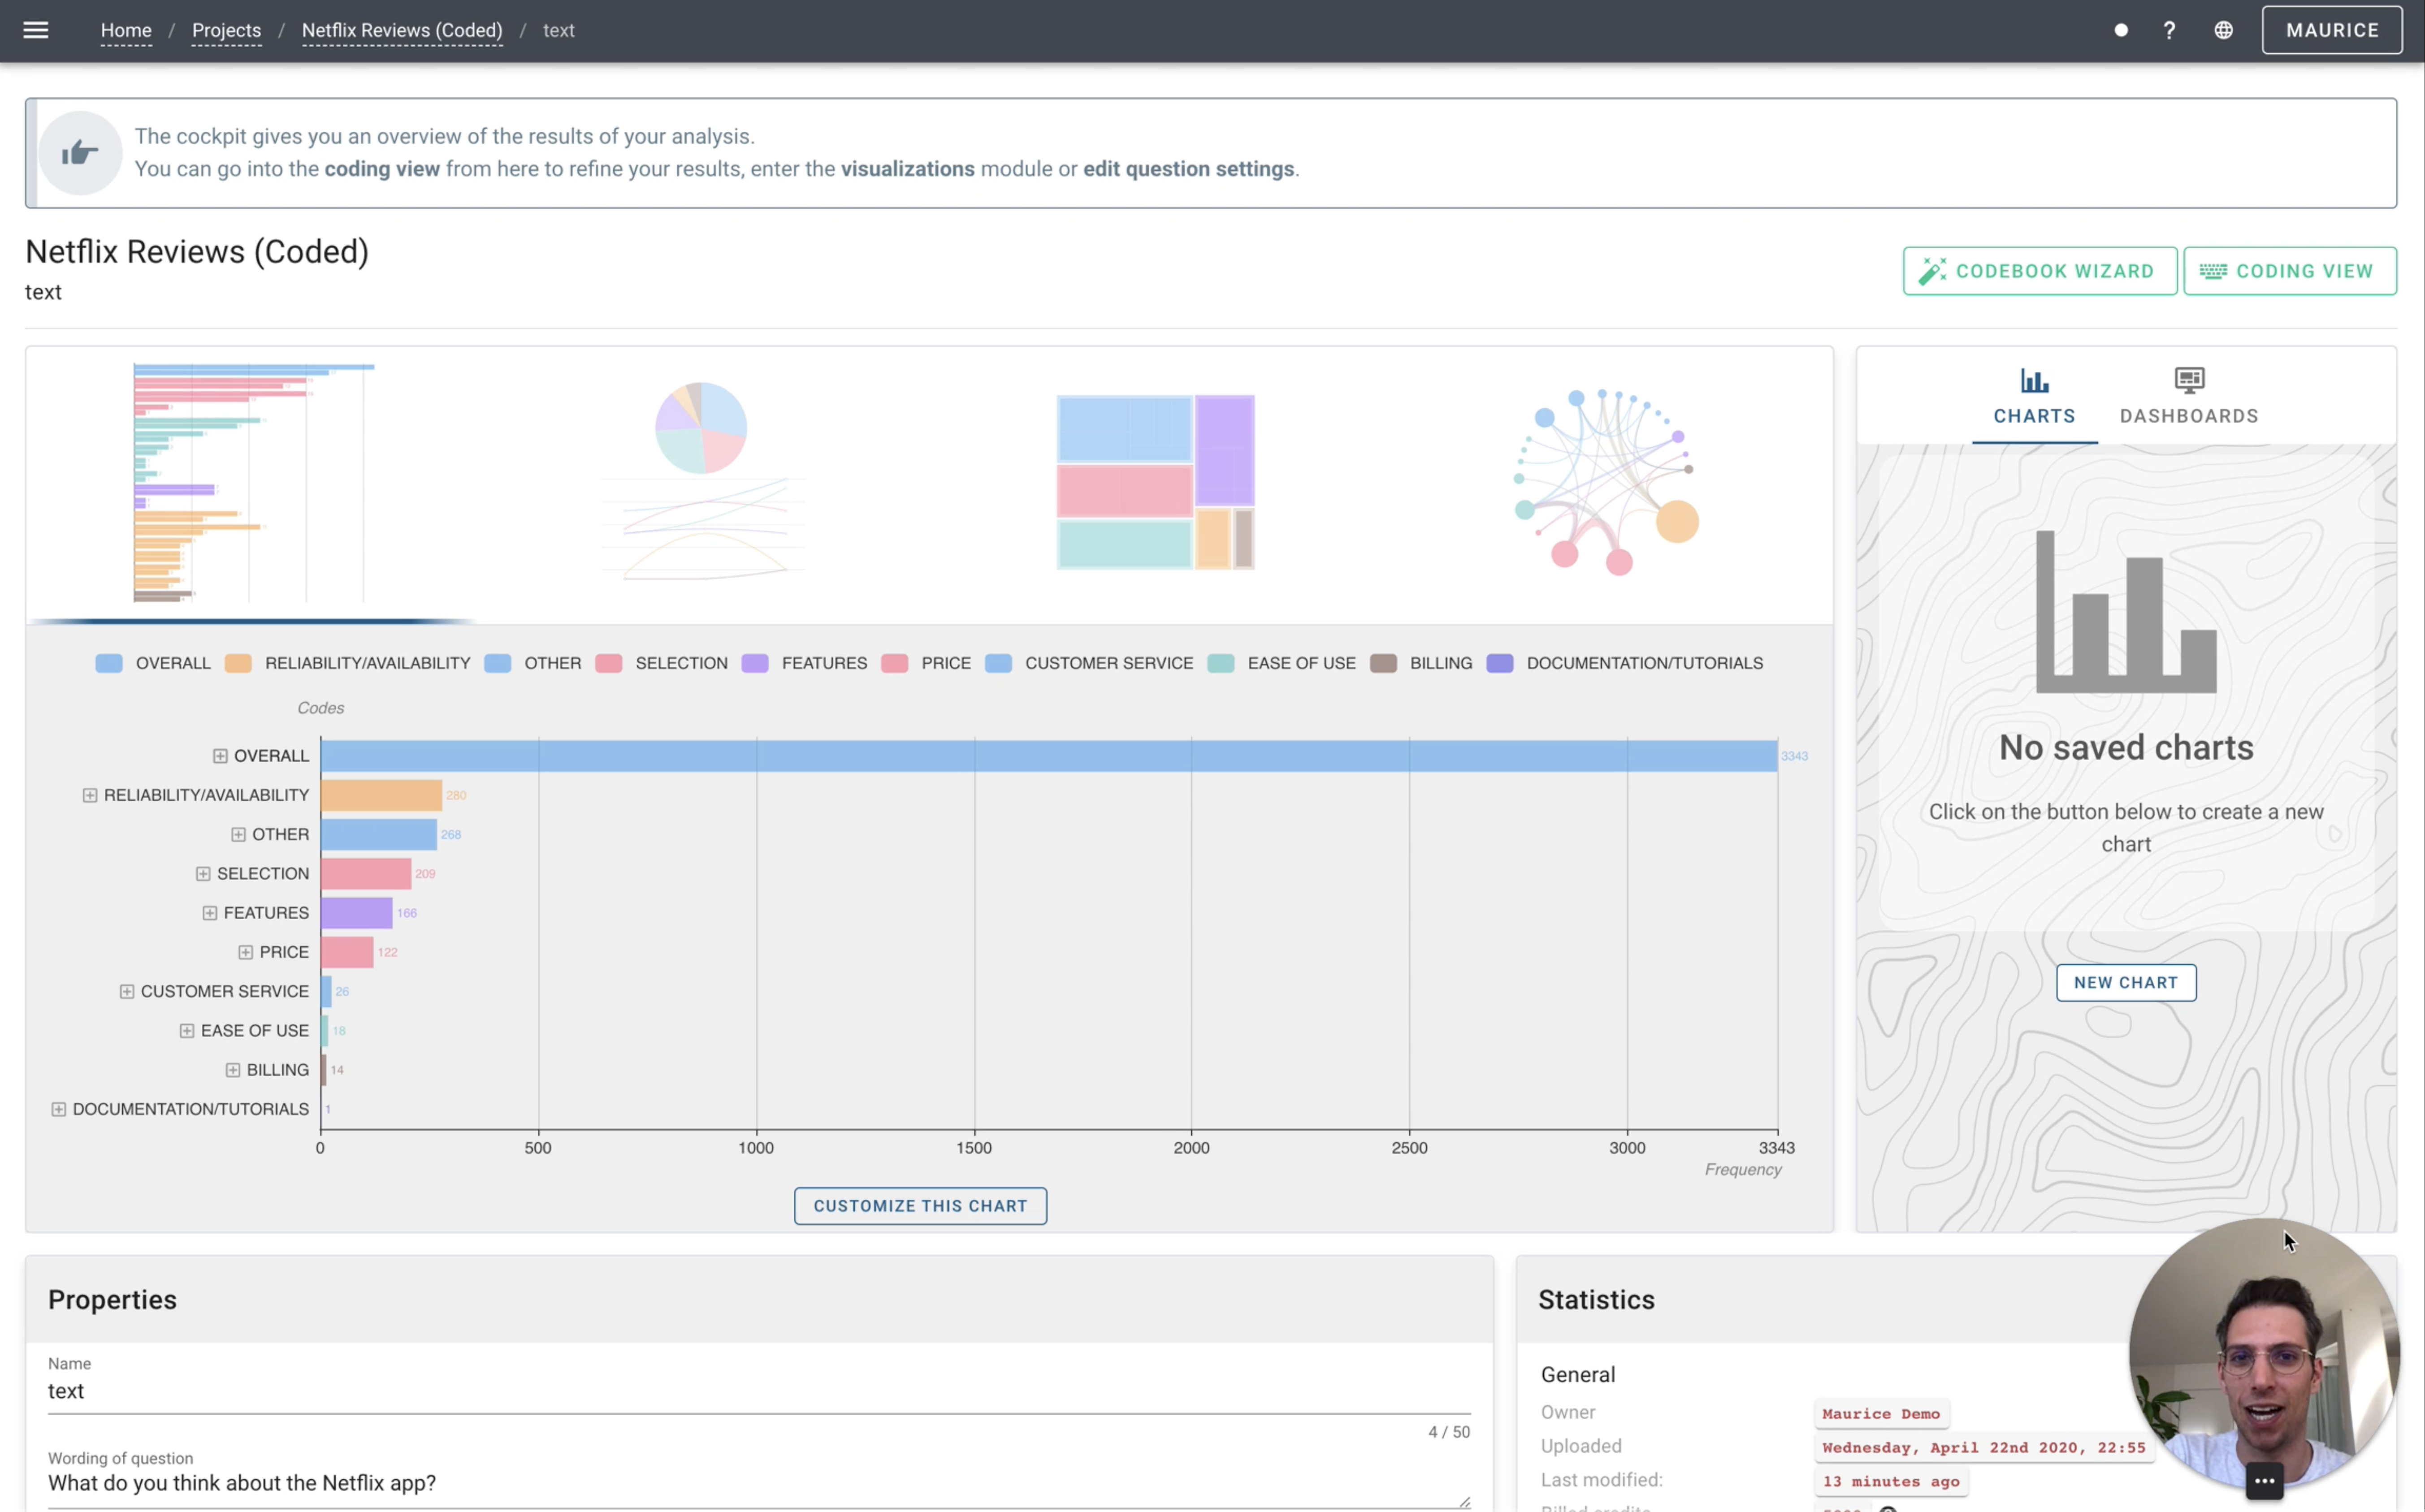
After the previous step, you have a codebook and the AI has assigned a code to every review where it thought it made sense. And it only took a couple of minutes.
After the previous step, you have a codebook and the AI has assigned a code to every review where it thought it made sense. And it only took a couple of minutes.
This assignment has happened for all 5000 reviews, done within minutes.
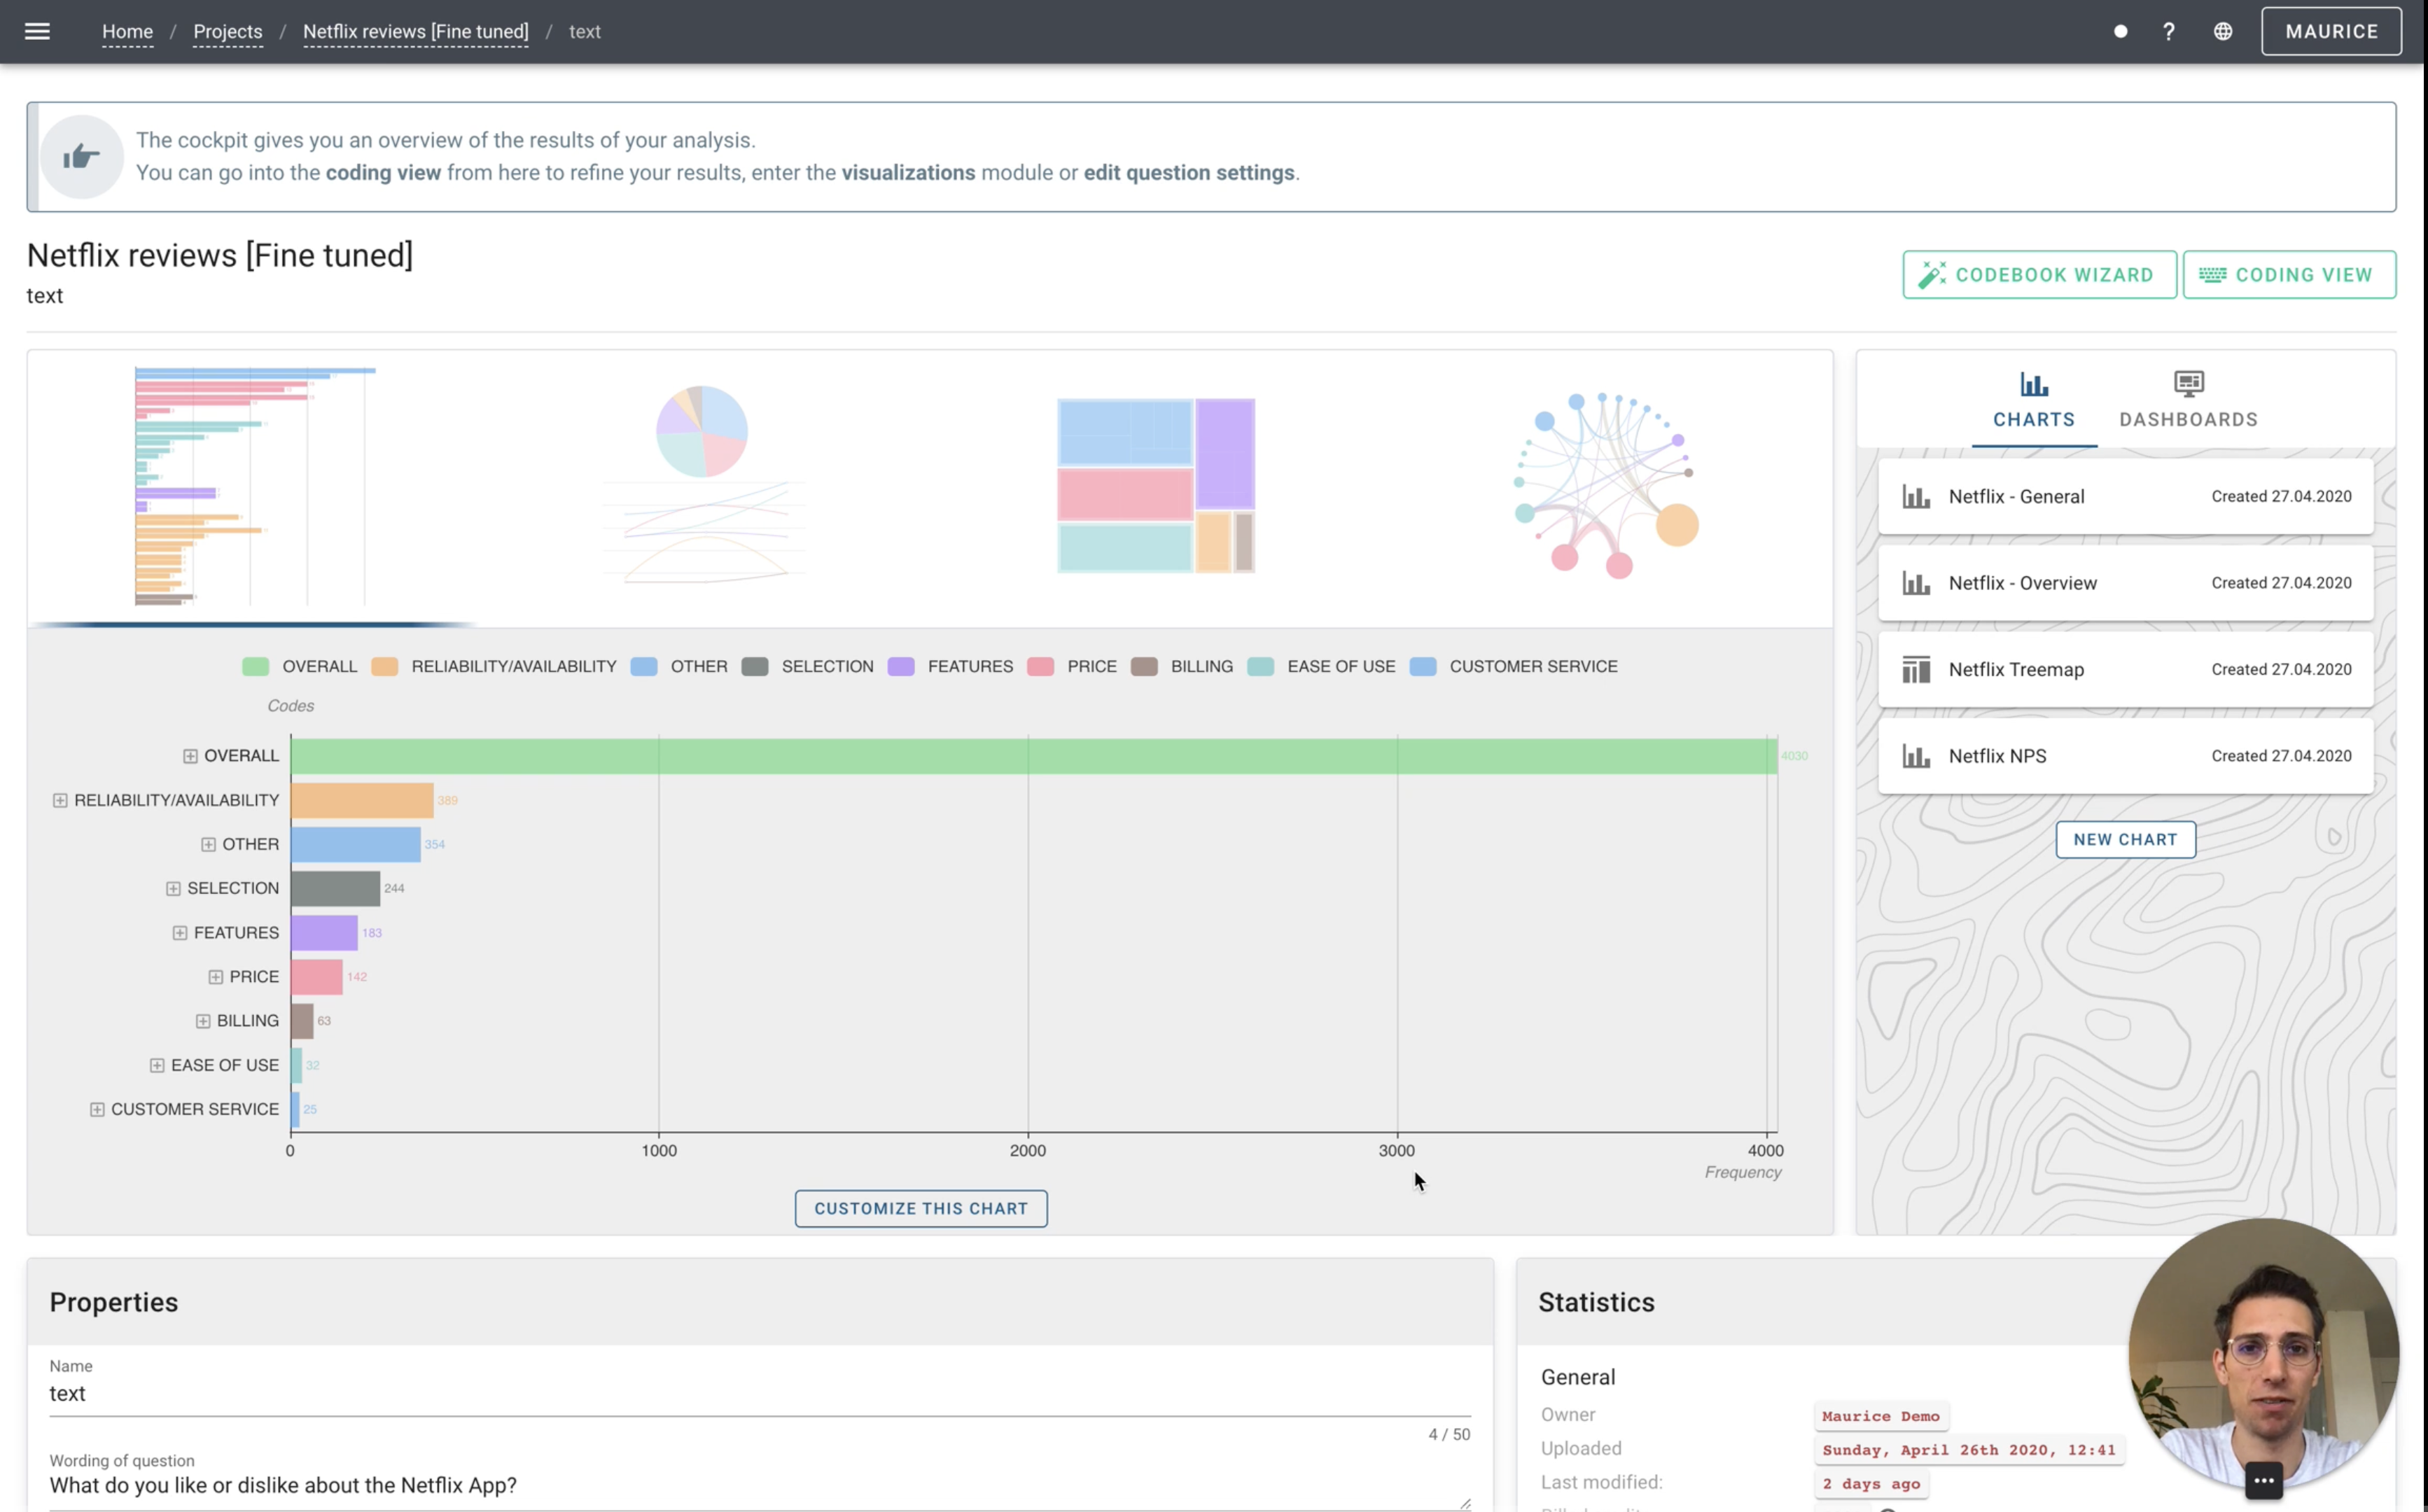
If we want to, we can now fine-tune the AI. The purpose of fine-tuning can be:
Adapting the codebook further as you discover further relevant topics,
Reducing the number of texts without code
Make sure the AI codes the responses in the way you want them to
(especially relevant for very complex codes)
Step 4: Visualizations & Netflix Insight Creation
Now that we have organized our unstructured text into structured categories, we can start making sense of the feedback. For this purpose, Caplena features a visualization module, which enables you to easily create charts and dashboards, which you can either download or share with your team/clients directly through a shareable link.
Check out this Netflix demo dashboard.
It took us less than 15 minutes to create.
Although the mechanics of creating bar, pie, line, treemap, or graph charts on Caplena are very simple, making real sense of your data is not. Distilling the relevant essences from the data and telling a compelling story with a few words and a handful of charts is the most crucial part of any analysis. It is also where you should invest most of your brainpower.
Conclusion
The process from the moment you have your open-ended text in Excel, to showcasing your results in an interactive dashboard can be completed within as little as 25 minutes. It is all about making use of today’s technologies in the most efficient way while spending your time on the things that machine learning cannot automate – like making sense of the results.
Related blog posts
Everything You Need to Know About The Job Market After Covid 🦠
In the last two years, our work practices have undergone some significant changes. At the present time, there appears to be an increase in the number of job switches. This article examines the reasons for this by analyzing various studies – as well as our own in-house survey.
6 Things That Make Christmas Markets so Irresistibly Christmassy
What are the most common things people mention when they talk about their most recent Christmas market visit? To find out, we studied three highly rated – but different – Christmas markets to analyze their Google reviews.

Customer Review Champion: Adidas vs Nike
Who is the GOAT, Messi or Ronaldo? Are you a Derrick Rose or LeBron James fan? Do you prefer Collin Morikawa or Rory McIlroy? Depending on your answers, it is likely we could predict your favorite footwear brand. How?
How to Collect Surveys and Conduct Feedback Analysis in 1 Day
The research world is like a toolbox. Within the toolbox are surveys, focus groups, and experiments. Recently, the size of this toolbox has increased with social media, internet-based surveys, and mobile phones being used more frequently...
Five Guys’ Marketing Strategy: A Customer Review Analysis
Five Guys caters to burger lovers seeking high-quality food and friendly service – all while keeping things simple. To understand how Five Guys operates its successful marketing strategy, we analyzed 1,236 Google Maps reviews using the text analysis tool, Caplena.
Everything You Need to Know About The Job Market After Covid 🦠
In the last two years, our work practices have undergone some significant changes. At the present time, there appears to be an increase in the number of job switches. This article examines the reasons for this by analyzing various studies – as well as our own in-house survey.
6 Things That Make Christmas Markets so Irresistibly Christmassy
What are the most common things people mention when they talk about their most recent Christmas market visit? To find out, we studied three highly rated – but different – Christmas markets to analyze their Google reviews.
Customer Review Champion: Adidas vs Nike
Who is the GOAT, Messi or Ronaldo? Are you a Derrick Rose or LeBron James fan? Do you prefer Collin Morikawa or Rory McIlroy? Depending on your answers, it is likely we could predict your favorite footwear brand. How?
How to Collect Surveys and Conduct Feedback Analysis in 1 Day
The research world is like a toolbox. Within the toolbox are surveys, focus groups, and experiments. Recently, the size of this toolbox has increased with social media, internet-based surveys, and mobile phones being used more frequently...
Five Guys’ Marketing Strategy: A Customer Review Analysis
Five Guys caters to burger lovers seeking high-quality food and friendly service – all while keeping things simple. To understand how Five Guys operates its successful marketing strategy, we analyzed 1,236 Google Maps reviews using the text analysis tool, Caplena.