Chart of the Month: The Treemap

Sheila Bugal

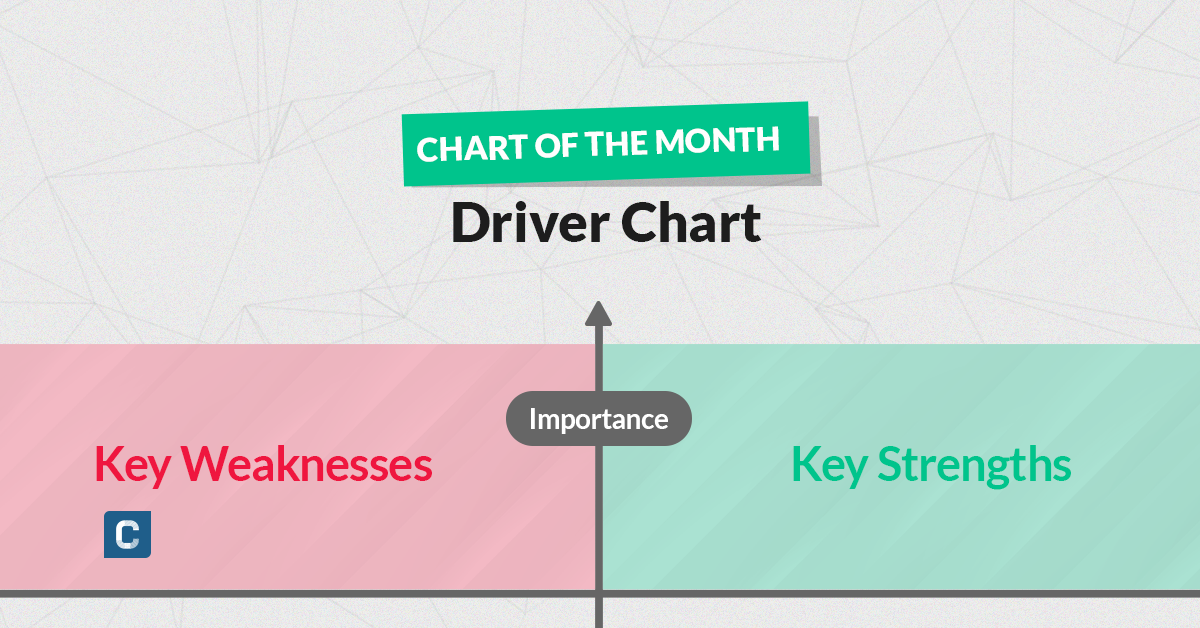
Having uploaded and processed your data to Caplena – what’s next? Text analysis is most effective when it explains key points through graphs, for example, using the relationship chart, understanding the driver chart, and analyzing the treemap!
What is a Treemap Chart?
Treemaps are used to present large amounts of hierarchically structured data, and, since Caplena’s text analysis results are hierarchical by nature, you can be pretty certain that most of your data will be suited for this type of chart. But – let’s not get ahead of ourselves and start with the basics first.
A Treemap is a type of graph where quantities are compared and hierarchical structures are visualized spatially through rectangular segments. Within the visualization, these segments vary in size and color and are sorted by a numerical variable. Rectangles contain smaller rectangles to represent the different ‘levels’. The main idea of this type of graph is to break up the data so that large and small units can be quickly identified.
The concept of a recursive construction allowing hierarchical data extension first originated in the early 1990s by Professor Ben Shneiderman (see the example below for one of the first Treemaps).
Treemap: How is the Square Size Determined?
Hard disk space usage visualized in TreeSize, the software first released in 1996
How the rectangles of Treemaps are sized depends on the algorithm which is used to define their size. There is an order to Caplena’s rectangle sizing, beginning with the largest square in the top left corner and ending with the smallest in the bottom right corner. The size of the rectangles is determined by the sum of their contained areas. Another useful feature within Caplena is that you can interact with the visualization as well. Simply click the desired square to see the coded verbatim responses associated with each square, or double-click on an area to zoom in on less frequent codes.
Still Unsure? Here’s a treemap example.
Imagine you are looking at a world map 🌍, and that the continents are represented by squares, instead. Let’s take Asia, one big square, which is further segmented into 48 squares to represent its countries. Next, we could take Europe – this overall square would be a lot smaller than Asia. Europe would have 44 respective smaller rectangles within it representing its respective countries. See the example below.
Source: Plotly
Is it not easier to comprehend the continents and their countries using such a visualization? Or would you rather scroll through 48 lines summing up a single continent? In most cases, the Treemap visualization of a continent would be preferred. This is because we do not need to go into great detail about every country to understand the continents’ puzzle pieces; we simply want to acknowledge their existence as a microcosm.
Treemaps for Text Analysis
As we are hopefully getting on the same page, let’s bring our attention back to Caplena. Caplena is a text analytics platform helping you reach insights from unstructured text using augmented intelligence. The gold standard in text analysis is to build a topic hierarchy (aka the codebook) and assign the topics (aka “codes“) to verbatims.
After uploading your open-ended feedback, Caplena’s Artificial Intelligence will search for hierarchies, patterns, and trends and learn from them. Once Caplena is finished, you are left with a set of organized data that has been assigned codes. Thus, the whole idea behind Treemaps is very well suited to text analytics data.
What should you use Treemaps for?
Having established that Treemaps are good for text analysis, let’s look at Treemap do-s & don’t-s in a more general context.
Avoid 👎
It is not recommended to use Treemaps for data with a wide range of magnitude, values with negative ranges, or for gauging values based on the length of the plot. Generally, avoid Treemaps for segmentation, as for example, comparing distribution by responded age.
Go Ahead 👍
It is recommended to use Treemaps when the data is hierarchical (which entails pretty much all of Caplena’s data). Treemaps offer the main benefit of allowing one to identify the most important elements in an organizational structure at a glance.
We could go on and on – but it’s always best to learn by doing, so we highly suggest you book a call with us so we can show you treemaps in action, or run a proof of concept with you. We are always happy to assist you with any questions you may have.
Related blog posts


How to Ask for Customer Feedback – And Get an Honest Response
Customer feedback is about more than knowing whether your customers give your product three stars or five stars (although that is a valuable insight). It’s also about gathering the information that can help you make critical decisions and improvements….


5 Ways to Effectively Measure and Utilize NPS
Your customers have an enormous amount of leverage when it comes to your brand’s reputation. What they tell other people can expand your business quickly or destroy new growth. That’s why it’s so important to measure NPS (Net Promoter Score).


Customer Surveys: Open-Ended vs. Multiple-Choice Questions
How do you decide on what kind of survey to use? We’re eliminating some of the guesswork for you by giving you foundational advice to creating an effective customer survey, and a good old-fashioned comparison between open-ended vs. multiple-choice.


Coop Case Study: Getting Actionable Insight From Mass Feedback Analysis
What do customers think about organic food? What do they like about the newly built store? Why do some customers feel 😊, while others feel 😩? These are questions that Coop, the Swiss Retailer wanted to find out!
How to Ask for Customer Feedback – And Get an Honest Response
Customer feedback is about more than knowing whether your customers give your product three stars or five stars (although that is a valuable insight). It’s also about gathering the information that can help you make critical decisions and improvements….
5 Ways to Effectively Measure and Utilize NPS
Your customers have an enormous amount of leverage when it comes to your brand’s reputation. What they tell other people can expand your business quickly or destroy new growth. That’s why it’s so important to measure NPS (Net Promoter Score).
Customer Surveys: Open-Ended vs. Multiple-Choice Questions
How do you decide on what kind of survey to use? We’re eliminating some of the guesswork for you by giving you foundational advice to creating an effective customer survey, and a good old-fashioned comparison between open-ended vs. multiple-choice.
Coop Case Study: Getting Actionable Insight From Mass Feedback Analysis
What do customers think about organic food? What do they like about the newly built store? Why do some customers feel 😊, while others feel 😩? These are questions that Coop, the Swiss Retailer wanted to find out!