Stay on top of news and best practices.
Caplena Secures €3M Pre-Series A Funding Round
24. July 2024 – Caplena, the leading AI feedback analytics company, has secured its pre-Series A funding round with €3M from Inveready, a prominent European technology VC, and Swiss investors, including Spicehaus Partners.
Customer Review Champion: Adidas vs Nike
Who is the GOAT, Messi or Ronaldo? Are you a Derrick Rose or LeBron James fan? Do you prefer Collin Morikawa or Rory McIlroy? Depending on your answers, it is likely we could predict your favorite footwear brand. How?
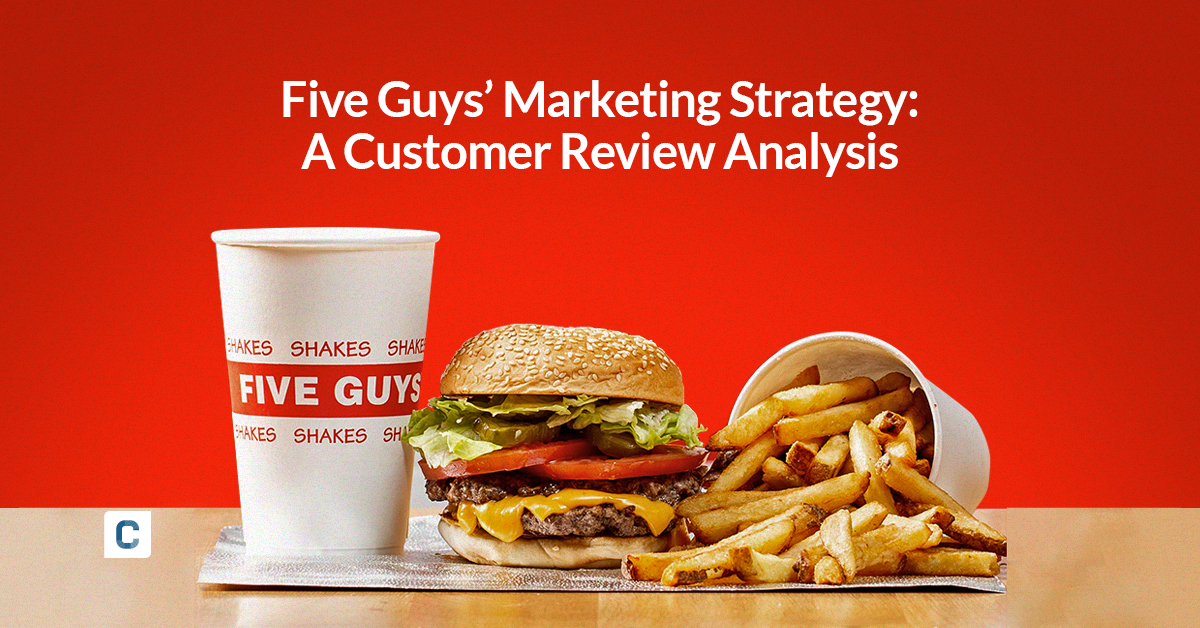
Five Guys’ Marketing Strategy: A Customer Review Analysis
Five Guys caters to burger lovers seeking high-quality food and friendly service – all while keeping things simple. To understand how Five Guys operates its successful marketing strategy, we analyzed 1,236 Google Maps reviews using the text analysis tool, Caplena.
A Stoic Breakdown: Sentiment Analysis
Unless you are a psychopath, humans are by nature emotional beings. Anger, sadness, happiness, and love are emotions that almost every human has felt. Nowadays, we have a plethora of emotional AI detection methods at hand. Sentiment analysis is one of the most used methods.
How to Collect Surveys and Conduct Feedback Analysis in 1 Day
The research world is like a toolbox. Within the toolbox are surveys, focus groups, and experiments. Recently, the size of this toolbox has increased with social media, internet-based surveys, and mobile phones being used more frequently...
6 Things That Make Christmas Markets so Irresistibly Christmassy
What are the most common things people mention when they talk about their most recent Christmas market visit? To find out, we studied three highly rated – but different – Christmas markets to analyze their Google reviews.
Everything You Need to Know About The Job Market After Covid 🦠
In the last two years, our work practices have undergone some significant changes. At the present time, there appears to be an increase in the number of job switches. This article examines the reasons for this by analyzing various studies – as well as our own in-house survey.
Analyzing Netflix Open-Ended Feedback: A 3½-Step Video Tutorial
This tutorial is all about Netflix! : We’ll take you through every step required to evaluate your open texts with the help of AI. If you follow the 3 required steps described in the guide below in all detail, it will take you approximately 45 minutes to get to achieve these results.
Coop Case Study: Getting Actionable Insight From Mass Feedback Analysis
What do customers think about organic food? What do they like about the newly built store? Why do some customers feel 😊, while others feel 😩? These are questions that Coop, the Swiss Retailer wanted to find out!
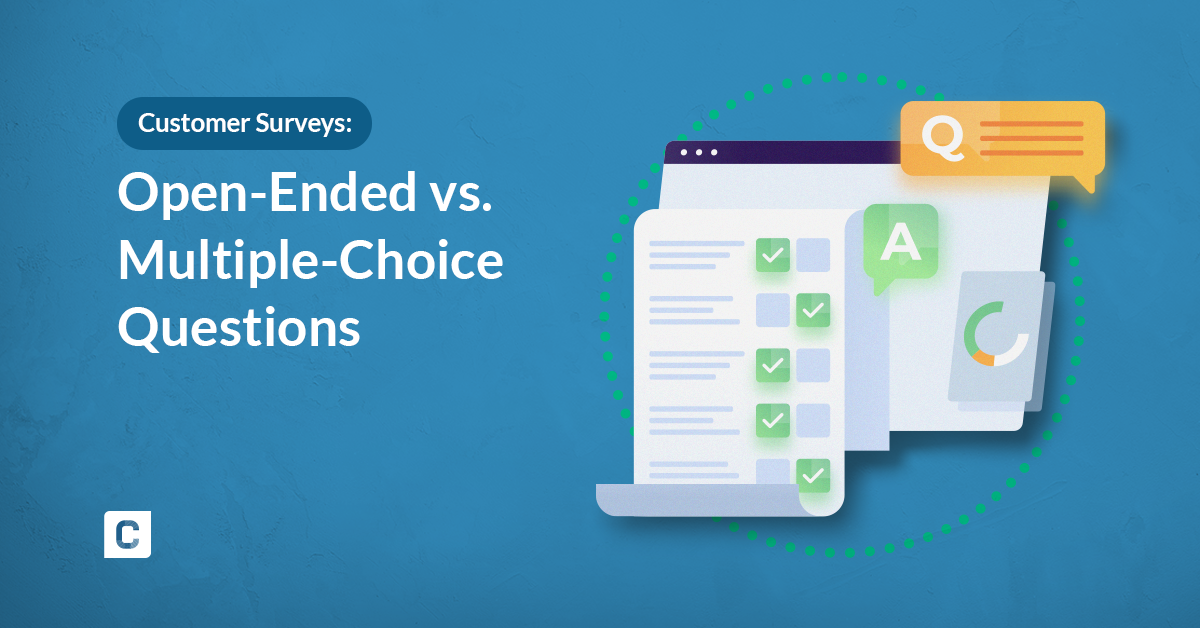
Customer Surveys: Open-Ended vs. Multiple-Choice Questions
How do you decide on what kind of survey to use? We’re eliminating some of the guesswork for you by giving you foundational advice to creating an effective customer survey, and a good old-fashioned comparison between open-ended vs. multiple-choice.
5 Ways to Effectively Measure and Utilize NPS
Your customers have an enormous amount of leverage when it comes to your brand’s reputation. What they tell other people can expand your business quickly or destroy new growth. That’s why it’s so important to measure NPS (Net Promoter Score).
How to Ask for Customer Feedback – And Get an Honest Response
Customer feedback is about more than knowing whether your customers give your product three stars or five stars (although that is a valuable insight). It’s also about gathering the information that can help you make critical decisions and improvements….
