May 2019
125k+
25
Data stream analyzed
In-app & app-store feedback as well as UX surveys
Thanks to Caplena, Joyn understands its users' needs & pain points like few other companies do.
Kilian Hughes, Director of Research & Insights @ Joyn
Joyn is a streaming platform from Germany, standing on the shoulder of the giant ProSiebenSat.1 and Discovery. With up to 3.9 million monthly unique users, Joyn is aiming to become the local streaming service number 1 in Germany. At Joyn it’s all about data & users. That’s why their research & insights team, led by the amazing Kilian Hughes, plays such a crucial role in product decisions.
Caplena: Kilian, tell me one thing you do differently than other insights teams?
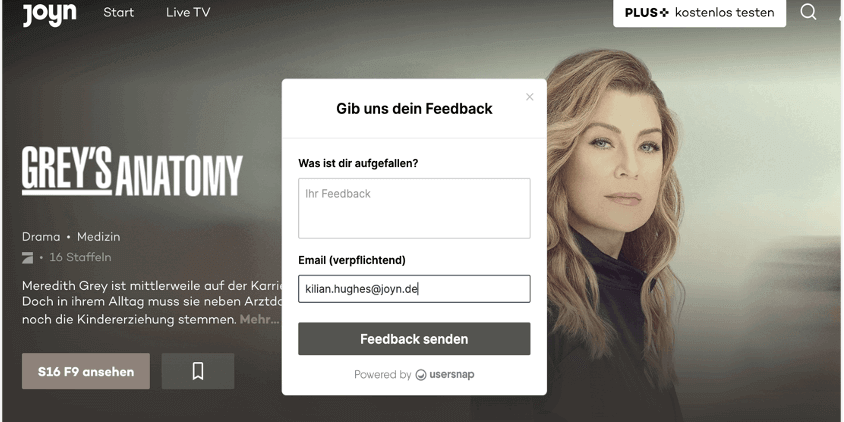
Kilian (Joyn): We go the extra mile to make it easy for our users to share their feedback. At every step of the user journey, there is at least one, often multiple ways to make yourself heard. For example: When in the app, just shake your smartphone and a feedback form will pop up.
Challenge
Joyn’s challenge is that their efforts in collecting user feedback were proving to be hugely successful: They collect over 800 feedbacks per week. Evaluating every one of these by hand would almost be a full-time job. Outsourcing this was no option either, as this would have cost a lot, aside from all the other downsides. Besides the actual analysis, data handling was another issue: You don’t want to send around CSV files by email every other day to update your dashboards. That’s both error-prone, slow and tedious.
Solution
In 2018 Kilian’s team decided to use Caplena to analyze their in-app and app-store feedback as well as UX surveys.
They implemented an automated pipeline: Feedback coming in from the Google Playstore or Instabug is ingested automatically into Caplena through a Zapier task. Once analyzed, the data is then transferred to Tableau to be shown in dashboards.
Caplena: What is your favorite feature on Caplena?
Kilian (Joyn): Our team loves the “transparent” automation concept of Caplena: Having a fully automatic analysis, but still being able to modify things that we interpret differently and the application and then learning from these changes is a truly powerful way of collaboration.
Results
Kilian’s team now only spends a couple of hours (instead of days) per week to process over 800 detailed feedbacks. The insights are:
Visualized in dashboards in real-time.
Delivered directly to the inbox of key teams as personalized, weekly digests.
Accessible for deep dives to product and UX teams upon demand.
Armed with this unbiased voice of the customer, Joyn’s research teams enable their product, UX and marketing teams to prioritize features, understand issues and foresee trends. For example, they guided their product team to prioritize Chromecast support, which significantly increased user satisfaction and app-store ratings.
Caplena: Do you have any recommendations for other teams setting up a semi or fully automated feedback analysis pipeline?
Kilian (Joyn): Start quickly, iterate fast. Often managers want to implement an all-encompassing solution suitable for every purpose and event. But this will result in huge, long-running projects which all too often fail. Be lean: Start, also if many things are still manual, but just start. Then automate one step after another. You will automatically prioritize the most tedious processes – and often those aren’t the ones you expected initially!
